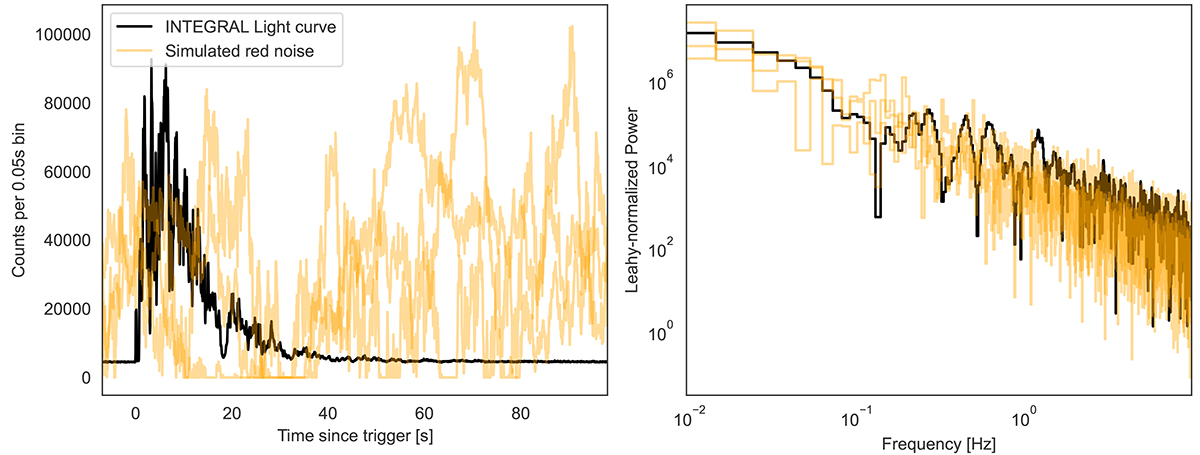
Fig. 4.

Download original image
Left: INTEGRAL light curve of GRB230307A (black), with three random light curves generated from the stochastic process used in the QPO detection methods outlined in this section (orange). The GRB has a well-defined beginning and an end, in between which there exists rapidly changing variability. The simulated light curves also contain variability at a high amplitude, but the overall process does not change throughout the light curve. This is expected for a stationary stochastic process. Right: Periodogram of the INTEGRAL data (black) and of the simulated light curves (orange). While the periodogram of the GRB exhibits peaks formed by excess power in correlated neighbouring frequency bins, the periodograms of the stochastic process contain – by design and construction – powers that are statistically independent.
Current usage metrics show cumulative count of Article Views (full-text article views including HTML views, PDF and ePub downloads, according to the available data) and Abstracts Views on Vision4Press platform.
Data correspond to usage on the plateform after 2015. The current usage metrics is available 48-96 hours after online publication and is updated daily on week days.
Initial download of the metrics may take a while.


