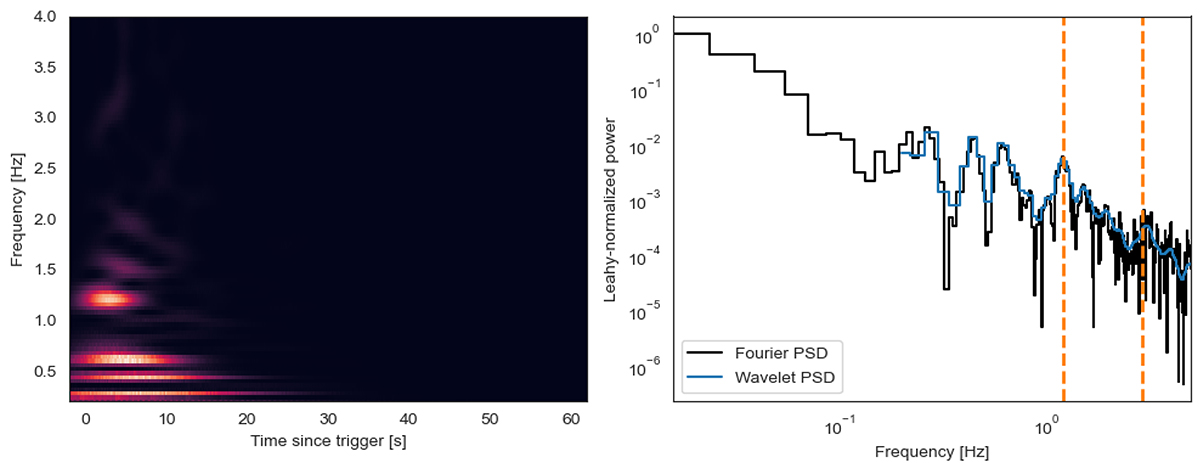
Fig. 5.
Download original image
Left: 2D wavelet transform (spectrogram) of the INTEGRAL observation of GRB230307A. The transform shows transient power at low frequencies in the first ∼20 seconds or so of the burst, where the variability is particularly strong. It also shows a short, transient signal between 0 − 10 s at 1.2 Hz, similarly to what was identified in the Fourier periodogram. The candidate signal at 0.32 Hz identified in the Fourier periodogram is less apparent here. Right: Fourier periodogram (black) and wavelet periodogram (blue) with the candidate signals found in the Fourier analysis noted as dashed orange lines. The Fourier and wavelet periodograms largely match.
Current usage metrics show cumulative count of Article Views (full-text article views including HTML views, PDF and ePub downloads, according to the available data) and Abstracts Views on Vision4Press platform.
Data correspond to usage on the plateform after 2015. The current usage metrics is available 48-96 hours after online publication and is updated daily on week days.
Initial download of the metrics may take a while.