Fig. 6.
Download original image
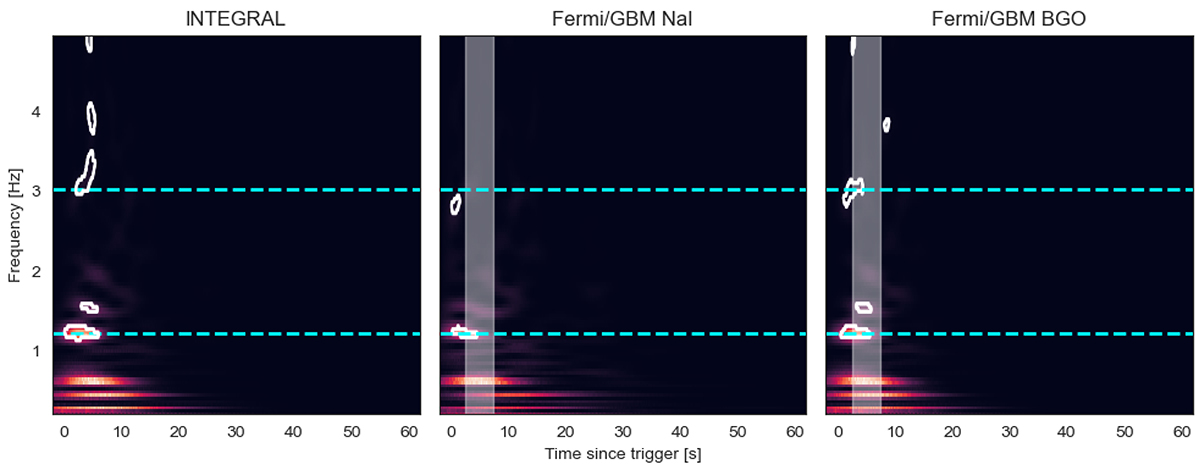
Wavelet spectrograms for GRB 230307A for all three instruments. In all three, we find significant power at the lowest frequencies, as well as power at 1.2 Hz. In white contours, we overplot the 99.99% percentiles. In the Fermi/GBM data, we mark the segment flagged by the Fermi team for potential data issues as the shaded region.
Current usage metrics show cumulative count of Article Views (full-text article views including HTML views, PDF and ePub downloads, according to the available data) and Abstracts Views on Vision4Press platform.
Data correspond to usage on the plateform after 2015. The current usage metrics is available 48-96 hours after online publication and is updated daily on week days.
Initial download of the metrics may take a while.