Fig. 7.
Download original image
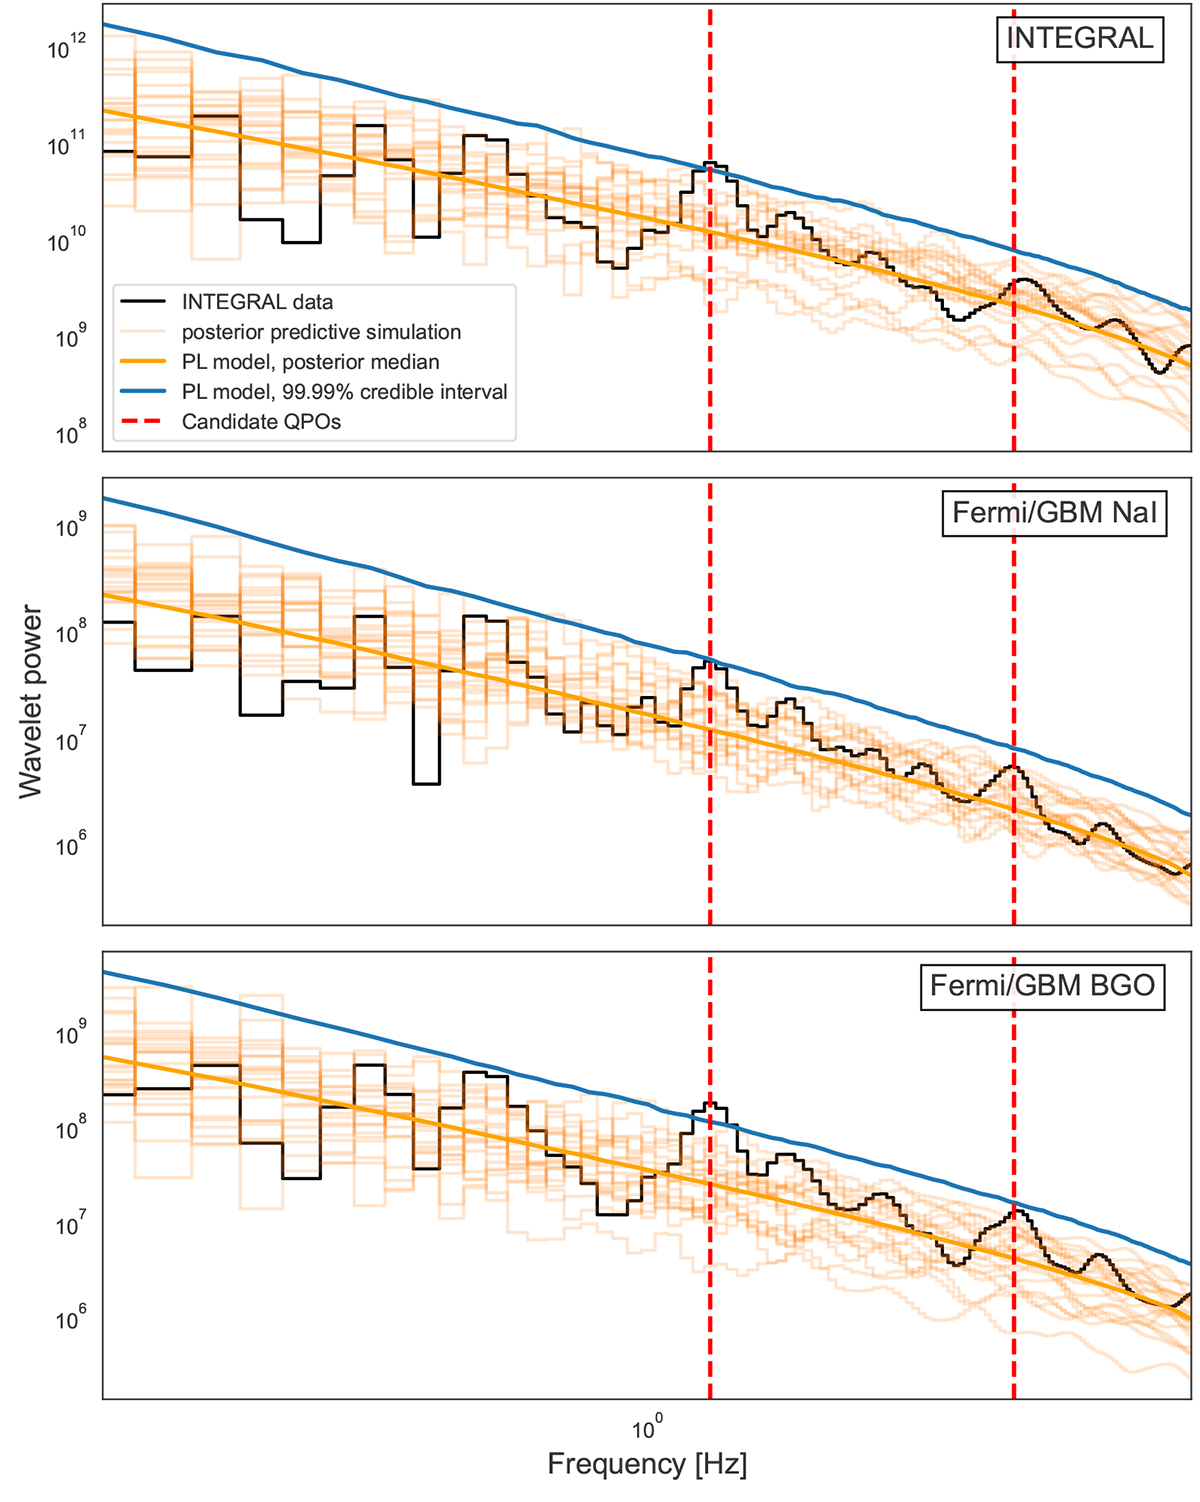
Wavelet periodograms (black) and red noise simulations (orange) for all three instruments (top: INTEGRAL; middle: Fermi/GBM NaI; bottom: Fermi/GBM BGO). The wavelet periodogram corresponds to the 2D wavelet spectrogram integrated over the time axis. In orange, the posterior mean derived from 1000 simulated wavelet periodograms, along with 10 posterior draws from the power-law stochastic model sampled in Section 3. In blue, we show the 99.99% single-trial detection limit. The candidate QPO at 1.2 Hz exceeds that limit for all three instruments, while the candidate QPO at 2.9 Hz exceeds this limit only for the Fermi/GBM BGO data. Note, however, that integrating over the time axis will necessarily yield lower significances given the short-lived nature of both candidate signals in the wavelet spectrogram.
Current usage metrics show cumulative count of Article Views (full-text article views including HTML views, PDF and ePub downloads, according to the available data) and Abstracts Views on Vision4Press platform.
Data correspond to usage on the plateform after 2015. The current usage metrics is available 48-96 hours after online publication and is updated daily on week days.
Initial download of the metrics may take a while.