Fig. 8.
Download original image
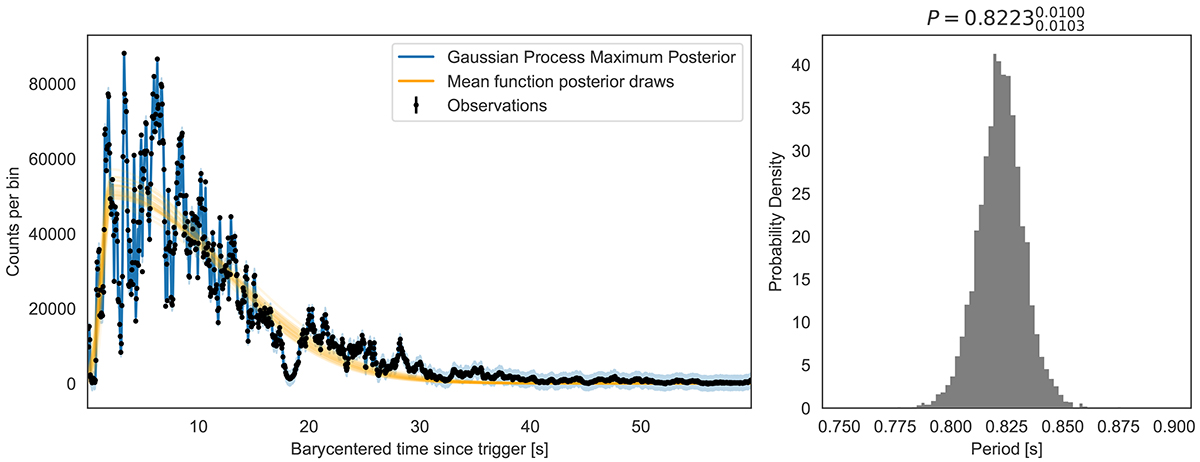
Left: SPI-ACS light curve (black points) in units of counts per 0.05 s bin, the predicted rates from the maximum a posteriori combined model consisting of the mean function, the stochastic process and a QPO (blue), and posterior draws from the mean function (orange). Right: Posterior probability density for the QPO centroid period.
Current usage metrics show cumulative count of Article Views (full-text article views including HTML views, PDF and ePub downloads, according to the available data) and Abstracts Views on Vision4Press platform.
Data correspond to usage on the plateform after 2015. The current usage metrics is available 48-96 hours after online publication and is updated daily on week days.
Initial download of the metrics may take a while.