Fig. 9.
Download original image
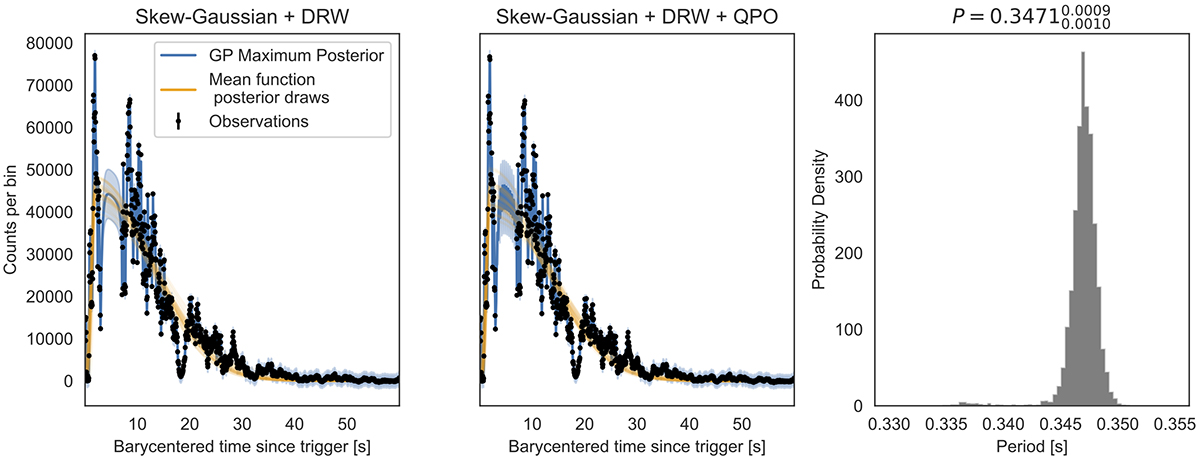
Re-analysis of the SPI-ACS data excising the brightest part of the GRB (i.e. BTI), which is affected by data loss in Fermi/GBM. In the left and middle panel, we show observations in black, the maximum a posteriori combined model in blue, and draws from the posterior probability density for the mean function in orange. The left-most panel shows the results for ℳ1 (skew-Gaussian mean function and DRW), the middle panel for ℳ2 (skew-Gaussian mean function, DRW and QPO). In the right-hand panel, we show the posterior probability density for the period of the QPO, which is narrowly constrained around P = 0.347 s.
Current usage metrics show cumulative count of Article Views (full-text article views including HTML views, PDF and ePub downloads, according to the available data) and Abstracts Views on Vision4Press platform.
Data correspond to usage on the plateform after 2015. The current usage metrics is available 48-96 hours after online publication and is updated daily on week days.
Initial download of the metrics may take a while.