Fig. 5
Download original image
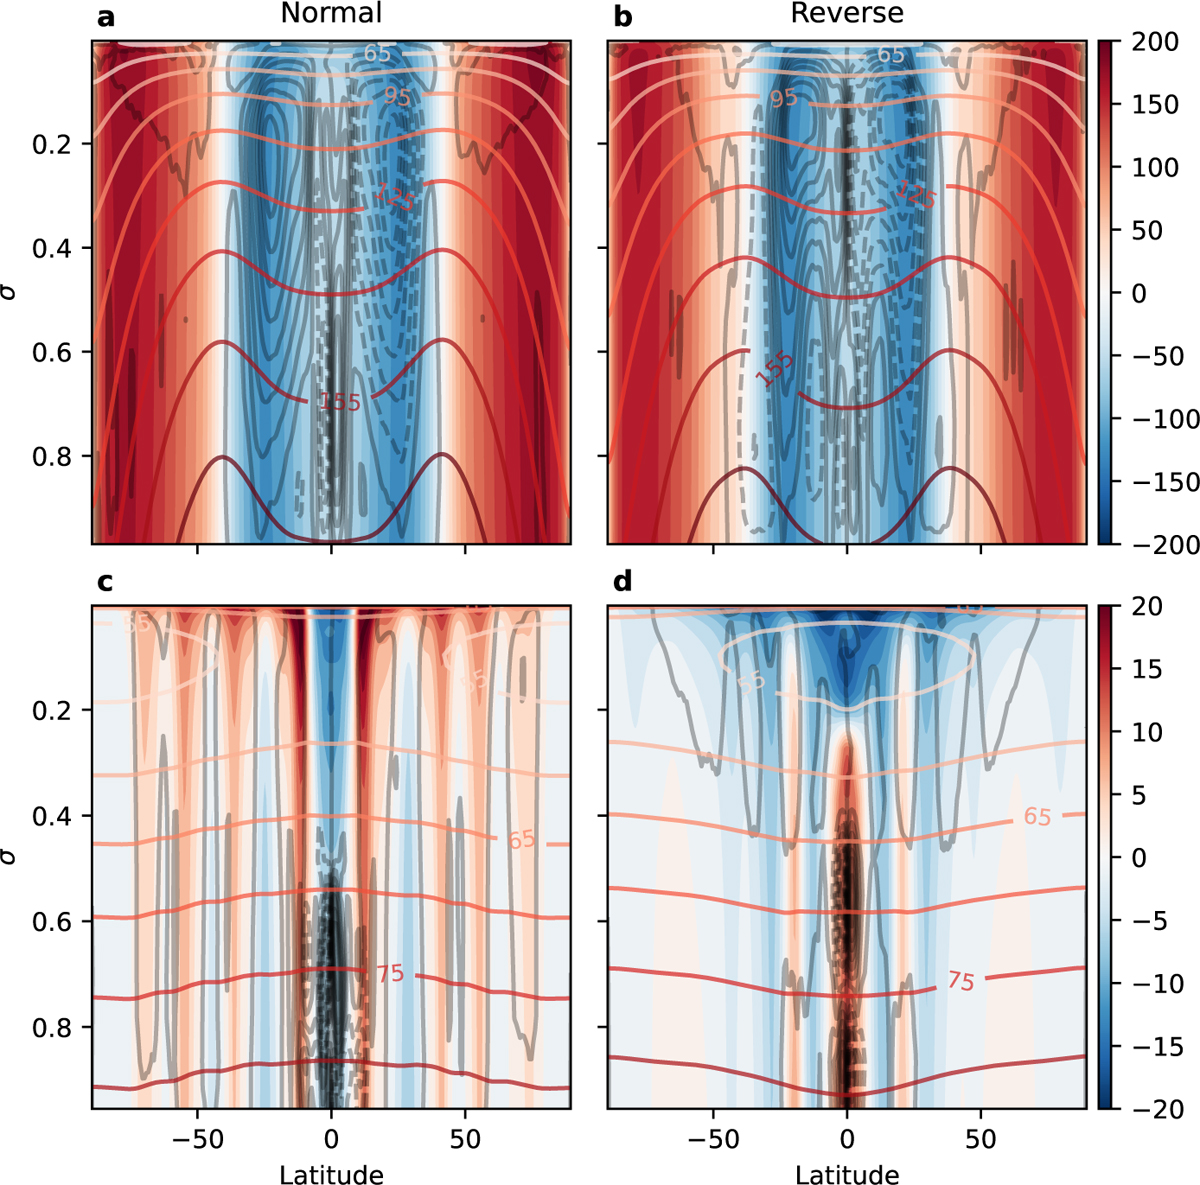
Comparison between the simulated flow using TNormal and TReverse for 10 and 1 bar (top and bottom row, respectively). The shading is for the zonal mean zonal wind, black contours are for the zonal mean meridional streamfunction, and red contours are for the temperature. All simulations are conducted with T170 horizontal resolution.
Current usage metrics show cumulative count of Article Views (full-text article views including HTML views, PDF and ePub downloads, according to the available data) and Abstracts Views on Vision4Press platform.
Data correspond to usage on the plateform after 2015. The current usage metrics is available 48-96 hours after online publication and is updated daily on week days.
Initial download of the metrics may take a while.