Open Access
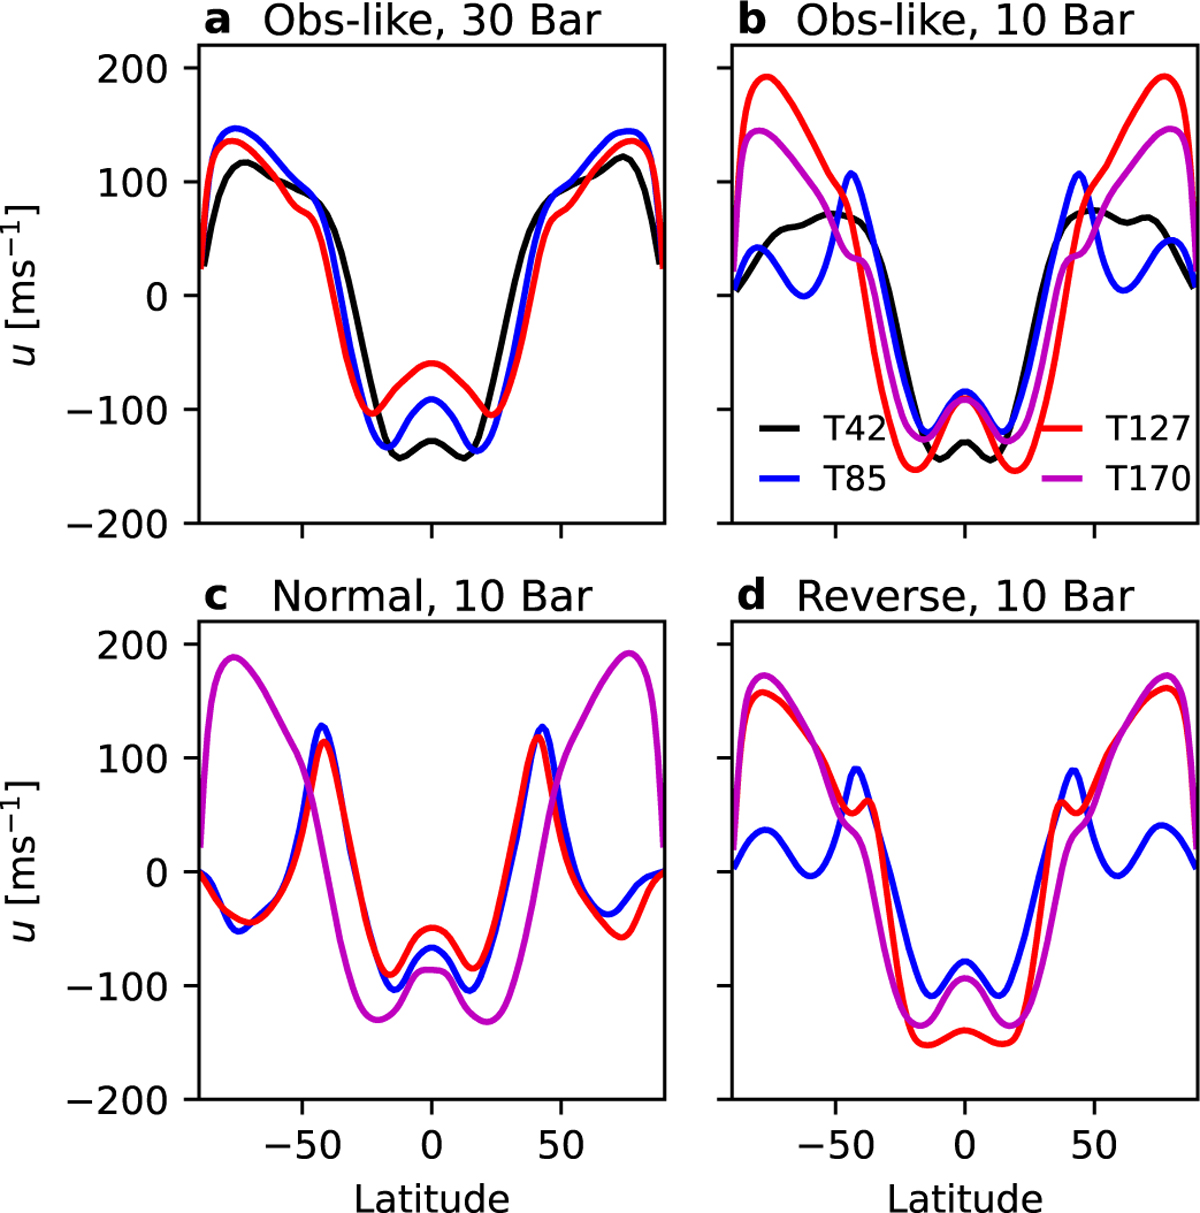
Fig. 6
Download original image
Zonal mean zonal wind (m s−1) as a function of latitude for idealized Teq experiments at different resolutions: T42 (black, panels a–b), T85 (blue), T127 (red), and T170 (magenta panels b–d). (a) 30 bar simulation with Obs-like Teq. (b–d) 10 bar simulations with Obs-like (b), Normal (c), and Reverse (d) Teq.
Current usage metrics show cumulative count of Article Views (full-text article views including HTML views, PDF and ePub downloads, according to the available data) and Abstracts Views on Vision4Press platform.
Data correspond to usage on the plateform after 2015. The current usage metrics is available 48-96 hours after online publication and is updated daily on week days.
Initial download of the metrics may take a while.