Fig. 7
Download original image
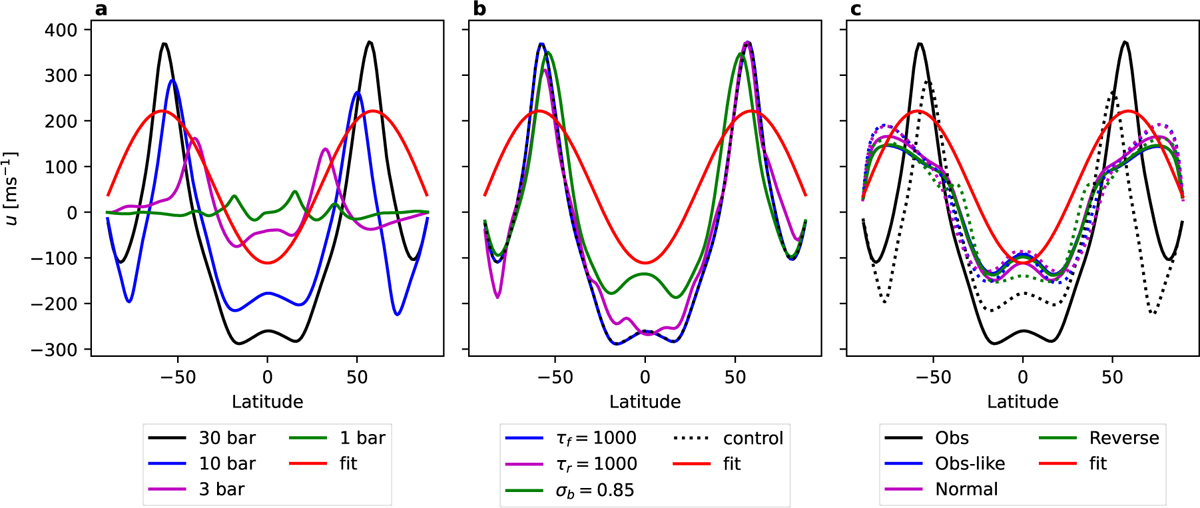
Zonal mean zonal winds at ~250 hPa for different model simulations. (a) Simulations with different bottom depths using TObs with resolutions detailed in Table 2 (b) Simulations testing the sensitivity to different model parameters using TObs and 30 bar bottom layer depth. (c) Simulations with the idealized Tfit forcing, where the dotted lines are for simulations with a depth of 10 bar. In all the panels the red curve is the analytical fit for the observation (Sromovsky & Fry 2005).
Current usage metrics show cumulative count of Article Views (full-text article views including HTML views, PDF and ePub downloads, according to the available data) and Abstracts Views on Vision4Press platform.
Data correspond to usage on the plateform after 2015. The current usage metrics is available 48-96 hours after online publication and is updated daily on week days.
Initial download of the metrics may take a while.