Fig. 1.
Download original image
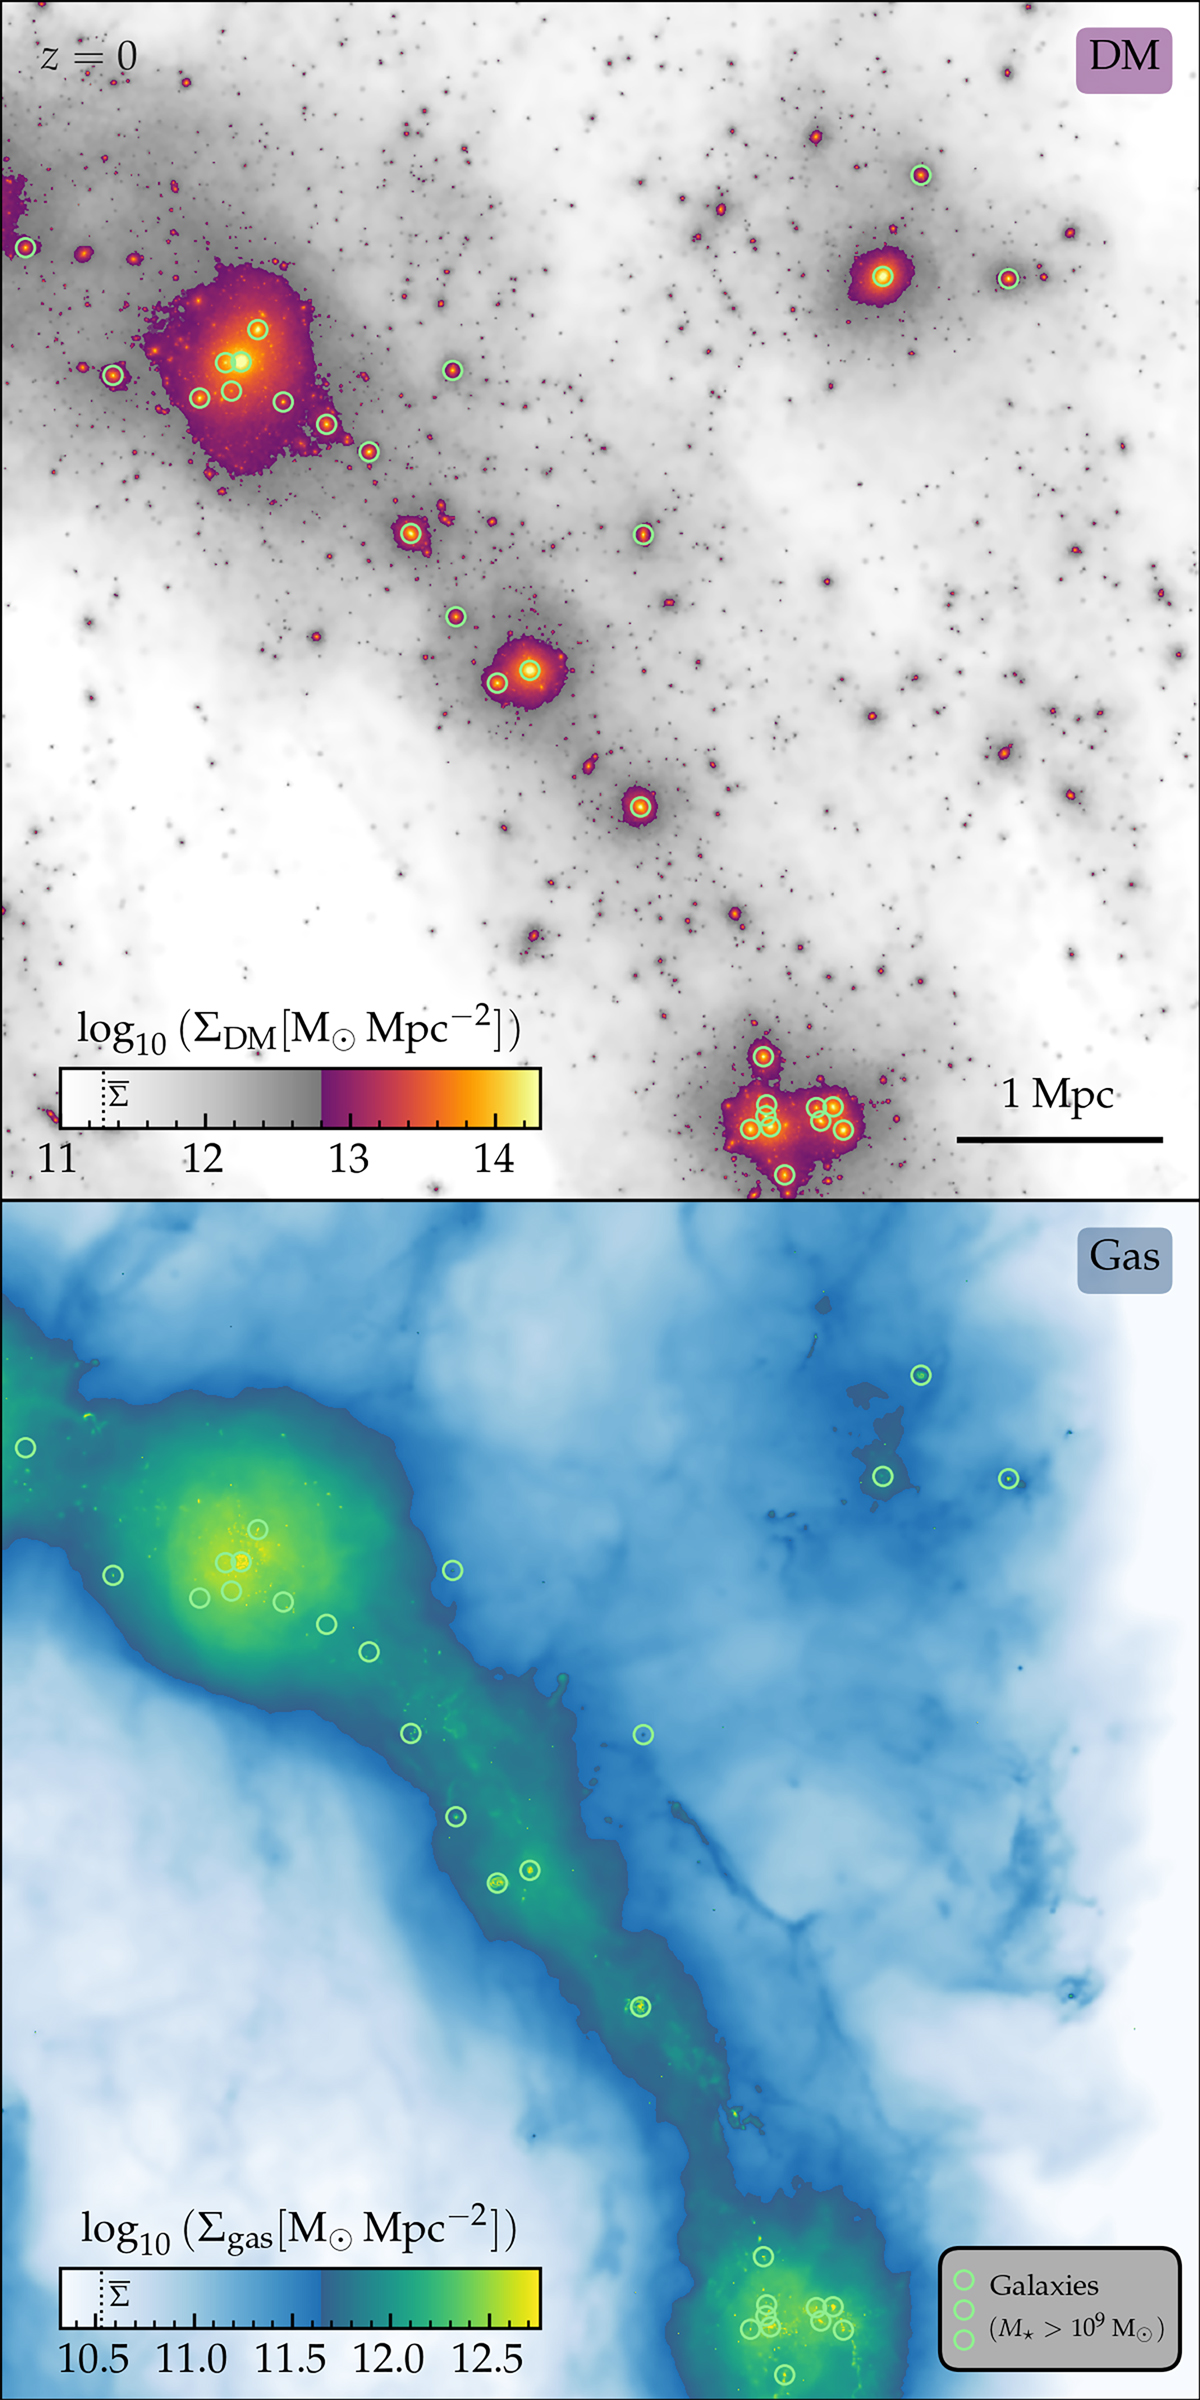
Close-up view of one filament in the EAGLE-Ref100 simulation. Shown is the dark matter (DM; top) and gas (bottom) surface density in a 6 × 6 × 6 Mpc cube at z = 0. In both cases, the colour map changes halfway between the cosmic average (![]() ) and the 99.99 percentile to highlight the low- and high-overdensity regions. Galaxies with Mstar > 109 M⊙ are depicted as open green circles. The DM is concentrated into clumps with a density > 10× above the smooth filament background. The gas is more smoothly distributed and shows a continuous filament structure, but still has noticeable peaks up to ≈5× the smooth background, due to the presence of galaxies and feedback-driven haloes. Neither corresponds to the smooth density field implicitly assumed by topological filament finders, which complicates the filament identification.
) and the 99.99 percentile to highlight the low- and high-overdensity regions. Galaxies with Mstar > 109 M⊙ are depicted as open green circles. The DM is concentrated into clumps with a density > 10× above the smooth filament background. The gas is more smoothly distributed and shows a continuous filament structure, but still has noticeable peaks up to ≈5× the smooth background, due to the presence of galaxies and feedback-driven haloes. Neither corresponds to the smooth density field implicitly assumed by topological filament finders, which complicates the filament identification.
Current usage metrics show cumulative count of Article Views (full-text article views including HTML views, PDF and ePub downloads, according to the available data) and Abstracts Views on Vision4Press platform.
Data correspond to usage on the plateform after 2015. The current usage metrics is available 48-96 hours after online publication and is updated daily on week days.
Initial download of the metrics may take a while.