Fig. 10.
Download original image
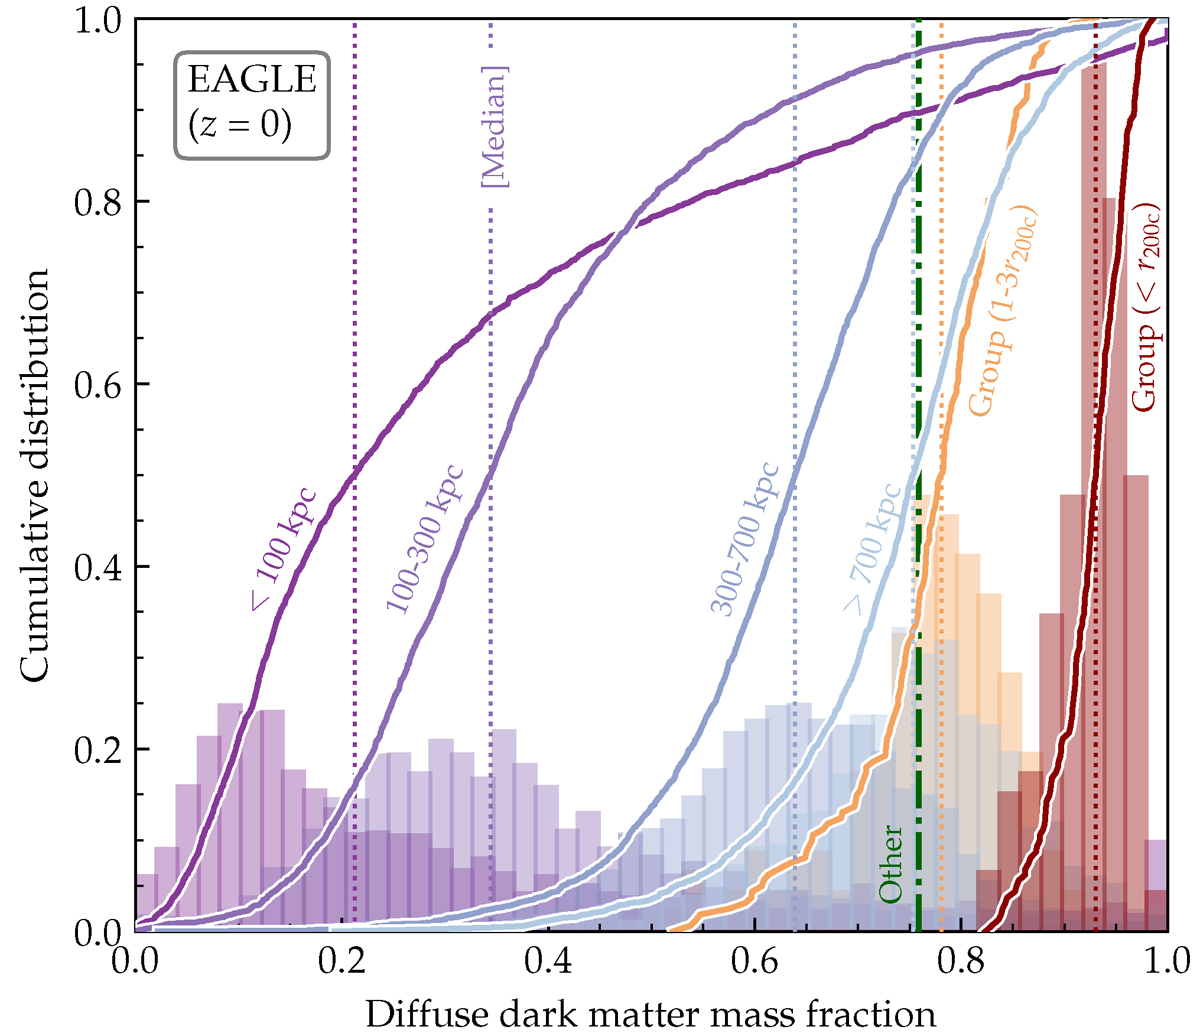
Diffuse dark matter (DM) mass fraction, fd, in filaments. Different shades of purple and blue represent different radial zones around the filament spines. Histograms and solid lines show the differential and cumulative distributions of diffuse fractions over individual filaments, with the correspondingly coloured dotted vertical line giving the median fraction. The analogous distributions for the centre and outskirts of groups are shown in red and orange, respectively, while the dash-dotted green vertical line marks the average diffuse fraction of DM outside of groups or identified filaments. Most filaments are substructure dominated in their centre (low fd), in contrast to groups.
Current usage metrics show cumulative count of Article Views (full-text article views including HTML views, PDF and ePub downloads, according to the available data) and Abstracts Views on Vision4Press platform.
Data correspond to usage on the plateform after 2015. The current usage metrics is available 48-96 hours after online publication and is updated daily on week days.
Initial download of the metrics may take a while.