Fig. 12.
Download original image
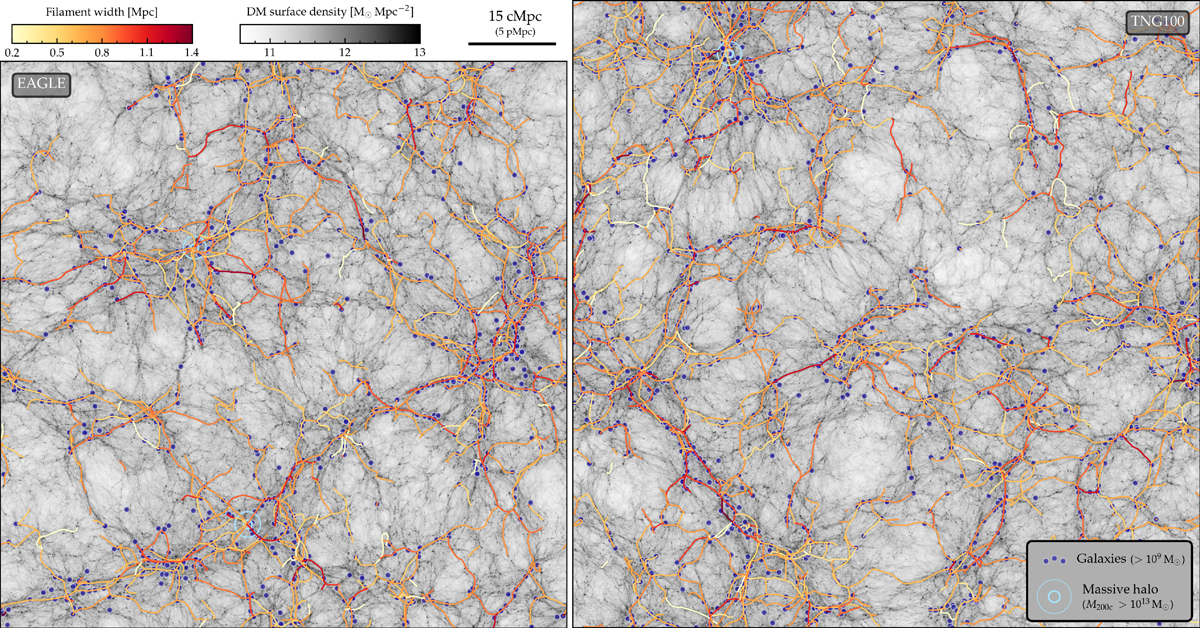
Filamentary skeleton at z = 2, analogous to the z = 0 skeleton shown in Fig. 2. EAGLE is shown on the left, TNG100 is on the right. Red and orange lines represent filaments in a 15 cMpc thick slice; background images show the dark matter (DM) density projected in the same slice. Galaxies with Mstar (z = 2) > 109 M⊙ are shown as indigo circles. As for z = 0, the filaments identified by DisPerSE correspond well to the main features of the DM density field, complemented by a myriad of unidentified thinner filaments.
Current usage metrics show cumulative count of Article Views (full-text article views including HTML views, PDF and ePub downloads, according to the available data) and Abstracts Views on Vision4Press platform.
Data correspond to usage on the plateform after 2015. The current usage metrics is available 48-96 hours after online publication and is updated daily on week days.
Initial download of the metrics may take a while.