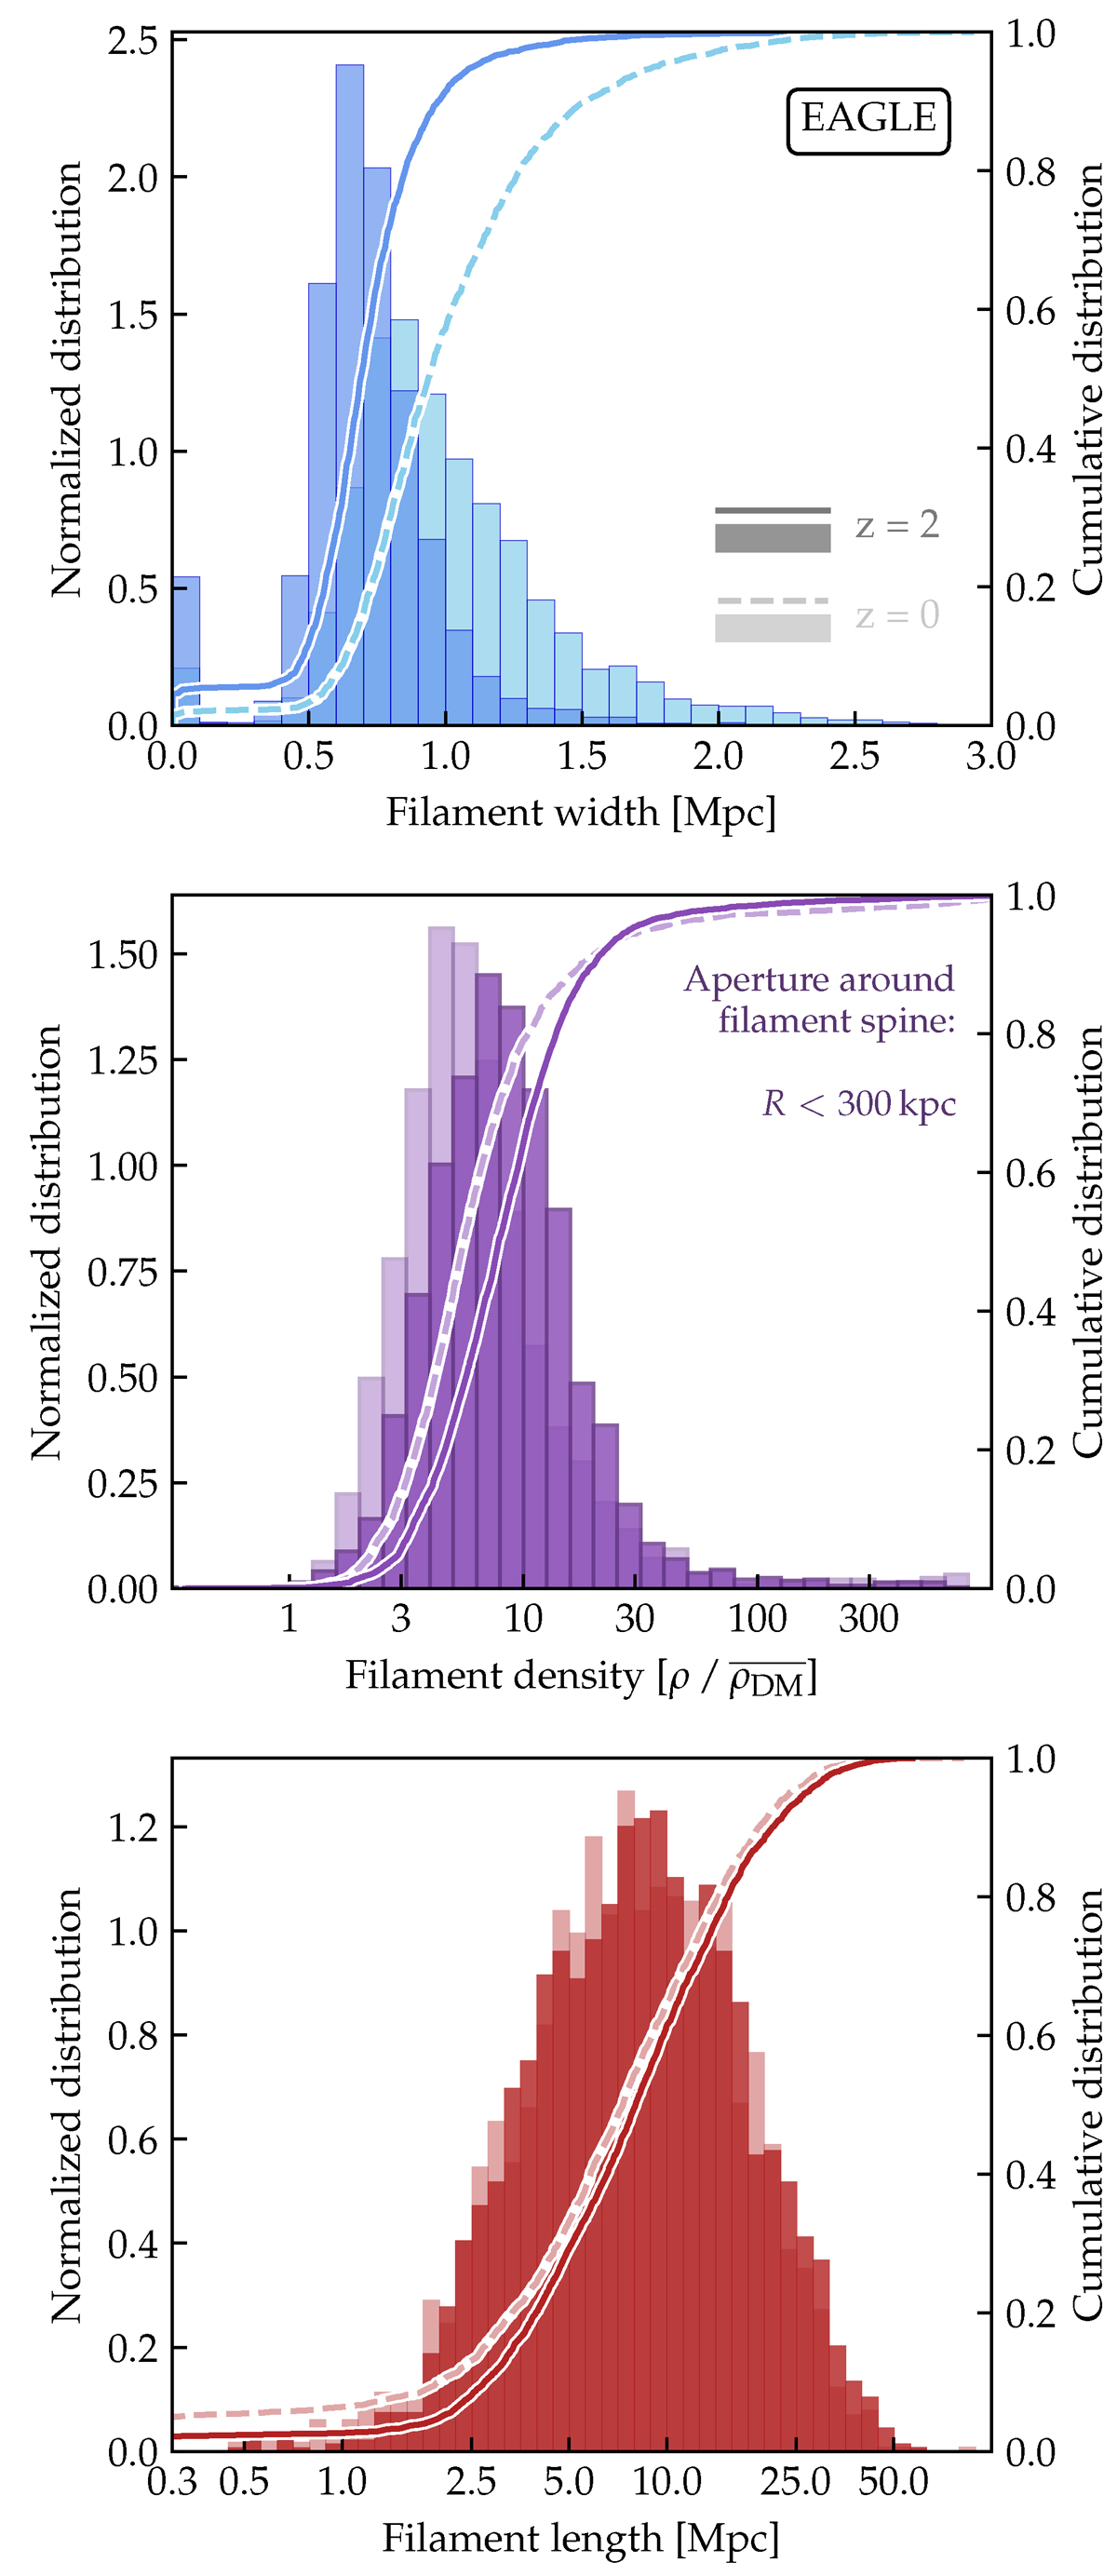
Fig. 13.
Download original image
Filament properties at z = 2 (dark colours and solid lines) compared to z = 0 (light colours, dashed lines). For clarity, only EAGLE is shown. In analogy to Fig. 7, we show the filament widths, central densities, and lengths in the top, middle, and bottom panels, respectively. Histograms represent the (normalised) differential distribution, whereas lines give the corresponding cumulative distributions. Even in co-moving coordinates, filaments are ≈30% thinner at z = 2 than at z = 0, while their central overdensities and (co-moving) lengths are consistent between the two epochs.
Current usage metrics show cumulative count of Article Views (full-text article views including HTML views, PDF and ePub downloads, according to the available data) and Abstracts Views on Vision4Press platform.
Data correspond to usage on the plateform after 2015. The current usage metrics is available 48-96 hours after online publication and is updated daily on week days.
Initial download of the metrics may take a while.