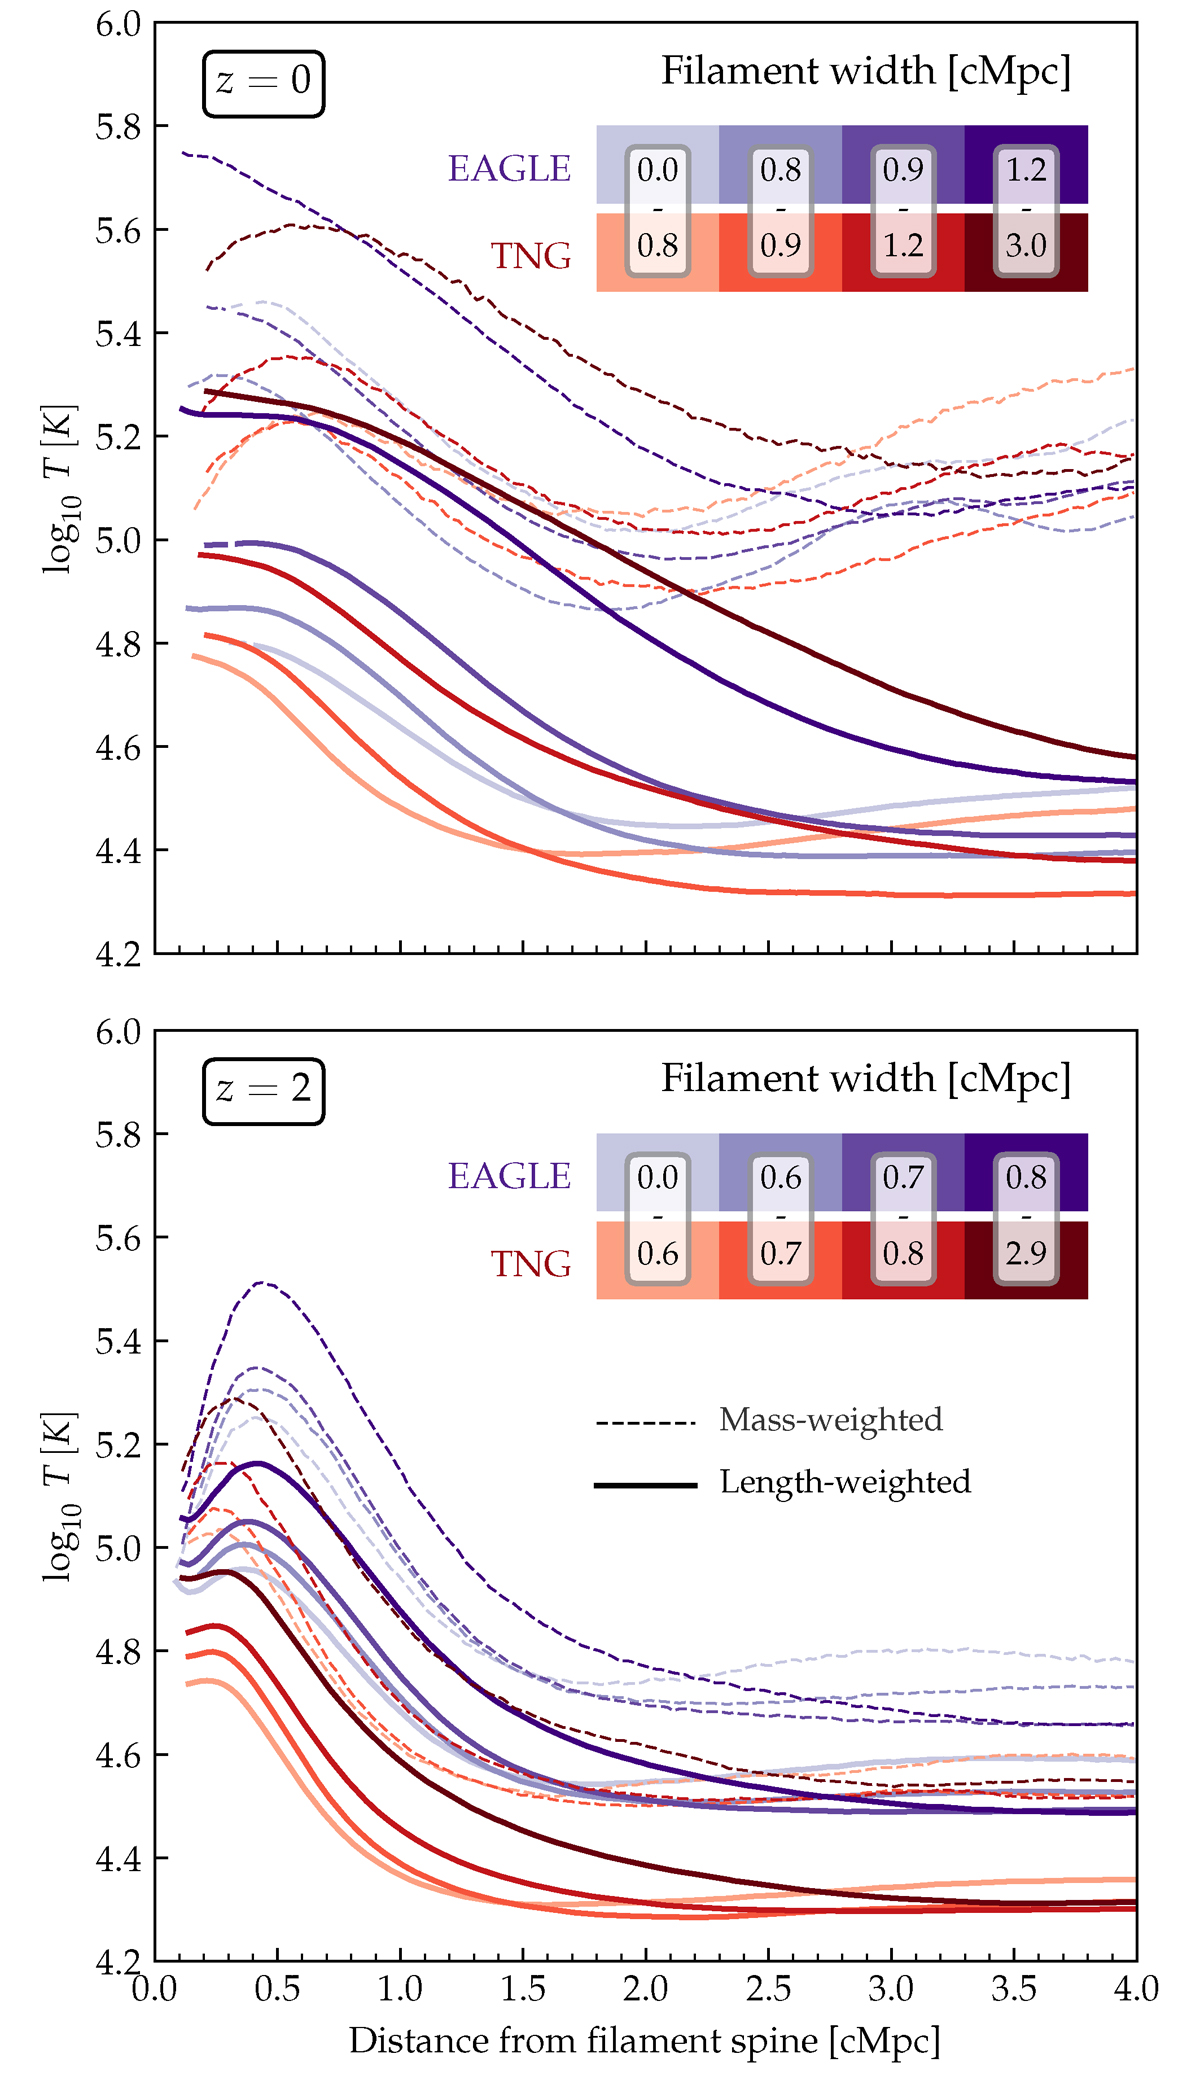
Fig. 14.
Download original image
Gas temperature profiles around filament spines at z = 0 (top) and z = 2 (bottom) for the EAGLE and TNG simulations (shades of purple and red, respectively). Filaments are split by their width as indicated in each panel; darker shades correspond to thicker filaments. For each bin, we show both the mass-weighted profile (thin dashed lines) and the length-weighted one (thick solid lines); see text for details. While temperatures are generally decreasing towards larger radii, there is considerable variation with filament width, weighting method, and at z = 2 also between the two simulations.
Current usage metrics show cumulative count of Article Views (full-text article views including HTML views, PDF and ePub downloads, according to the available data) and Abstracts Views on Vision4Press platform.
Data correspond to usage on the plateform after 2015. The current usage metrics is available 48-96 hours after online publication and is updated daily on week days.
Initial download of the metrics may take a while.