Fig. 17.
Download original image
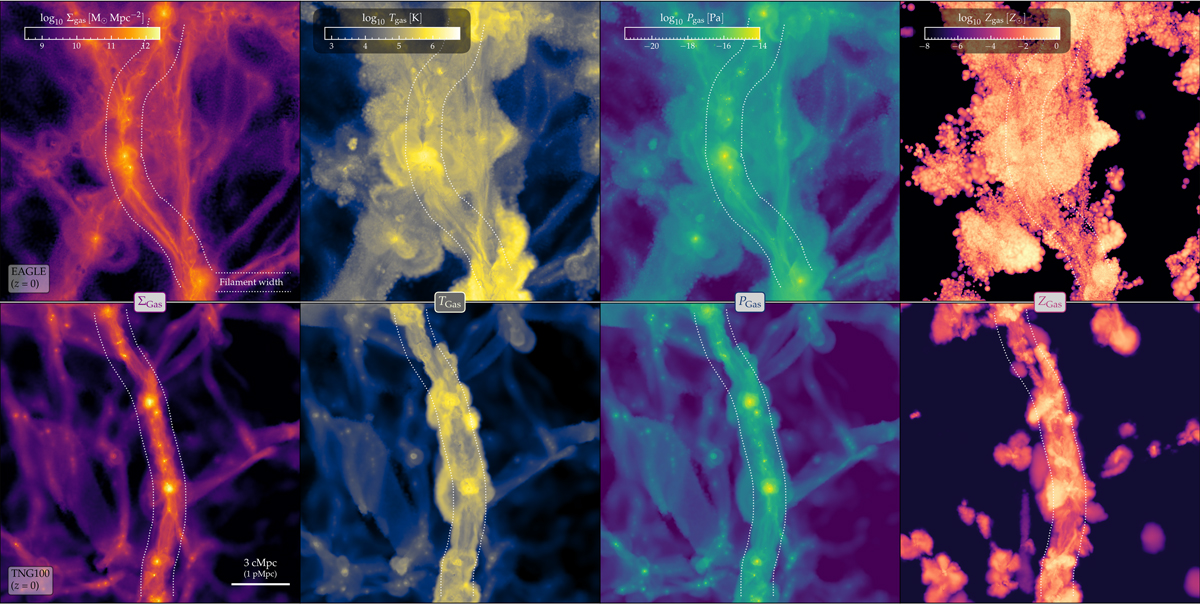
Detailed view of one representative filament at z = 0 in EAGLE (top) and TNG100 (bottom). From left to right, panels show maps of the gas density, temperature, pressure, and metallicity in a 16 × 16 × 1 Mpc slice aligned with the best-fit plane of the filament. White dotted lines trace the edges of each filament as identified from the dark matter. There is abundant structure within the filaments, both along and perpendicular to the spine, with clear differences between the two simulations (see text for details).
Current usage metrics show cumulative count of Article Views (full-text article views including HTML views, PDF and ePub downloads, according to the available data) and Abstracts Views on Vision4Press platform.
Data correspond to usage on the plateform after 2015. The current usage metrics is available 48-96 hours after online publication and is updated daily on week days.
Initial download of the metrics may take a while.