Fig. 19.
Download original image
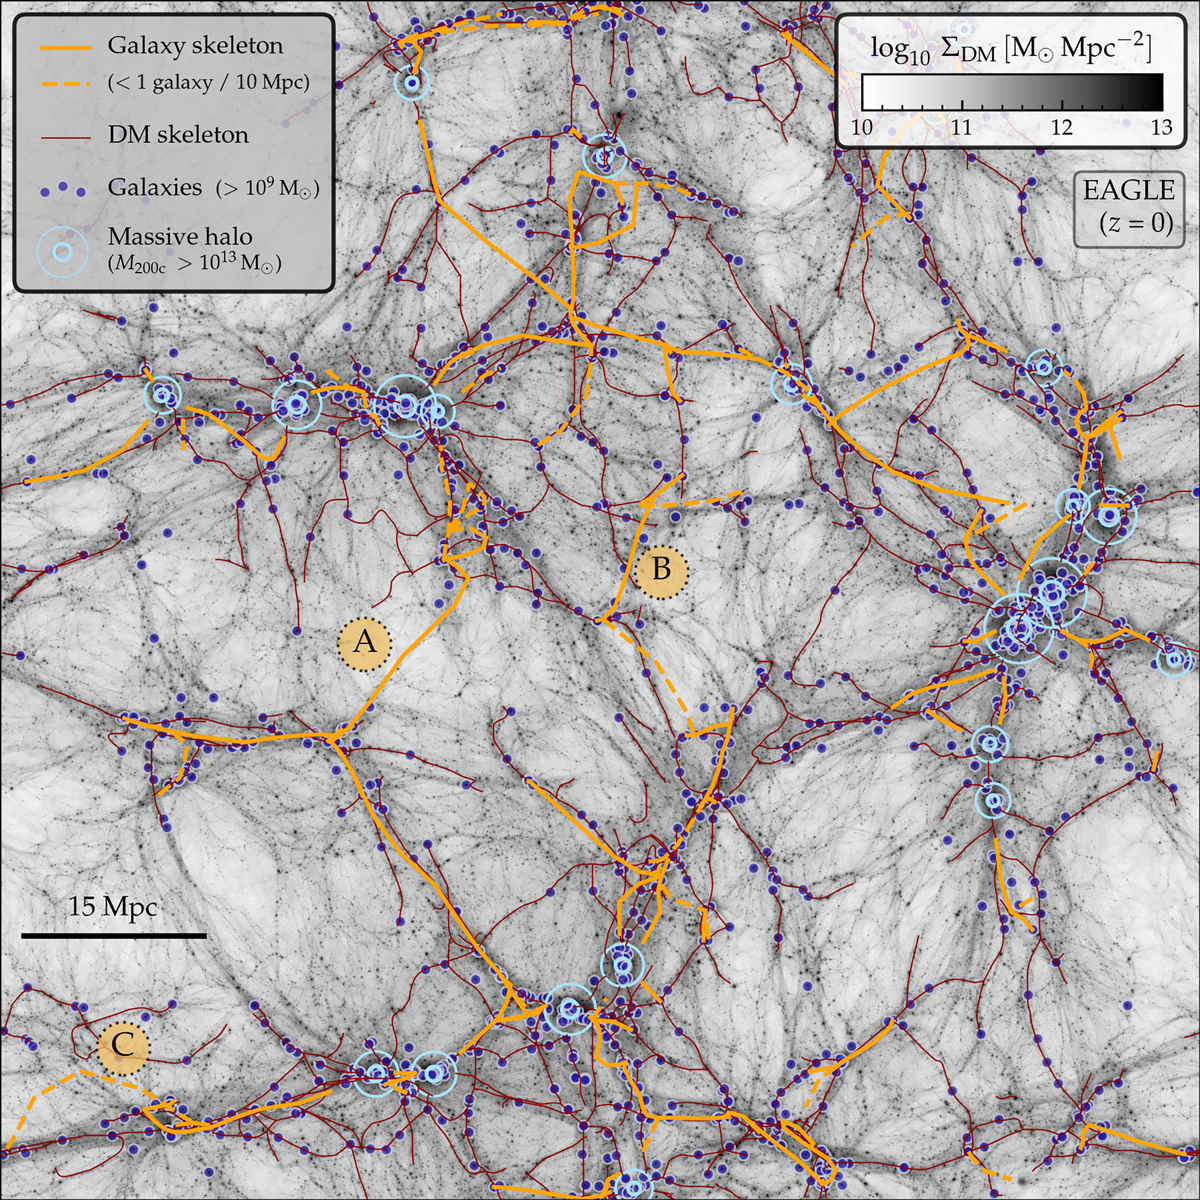
Filament network identified from galaxies (orange) compared with our fiducial reconstruction from the dark matter (DM) density field (dark red) for EAGLE at z = 0 showing the same 100 × 100 × 15 Mpc slice as in Fig. 2. The greyscale background represents the DM surface density, while indigo points and light blue circles denote galaxies with Mstar > 109 M⊙ and haloes with M200c > 1013 M⊙, respectively. The galaxy-based network broadly captures the thicker DM-filaments, but misses most finer structures and suffers from a number of artefacts, examples of which are labelled as ‘A’, ‘B’, and ‘C’ (see text for details).
Current usage metrics show cumulative count of Article Views (full-text article views including HTML views, PDF and ePub downloads, according to the available data) and Abstracts Views on Vision4Press platform.
Data correspond to usage on the plateform after 2015. The current usage metrics is available 48-96 hours after online publication and is updated daily on week days.
Initial download of the metrics may take a while.