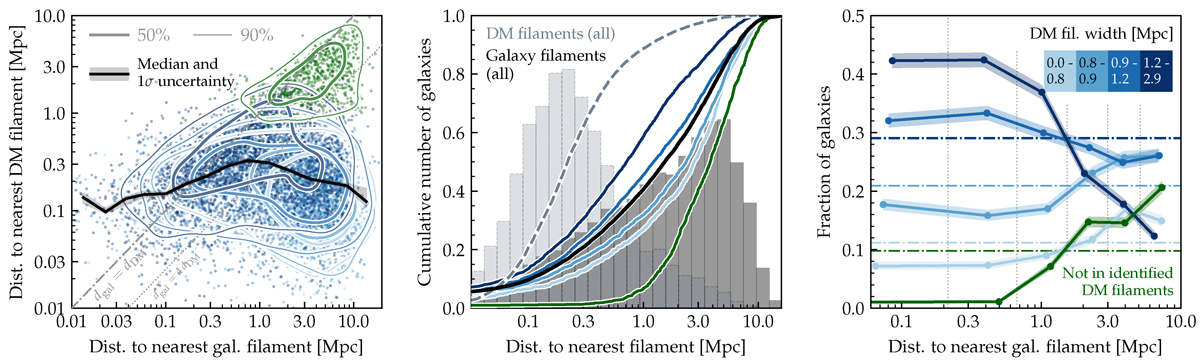
Fig. 20.
Download original image
Association of galaxies (Mstar > 109 M⊙, excluding those near a group or cluster) to filaments identified from galaxies and from dark matter (DM). Shades of blue indicate DM-filaments of different width (see top-right corner of the right-hand panel), green denotes galaxies that do not belong to any identified DM filament. Left: Comparison of distances to the spine of the nearest DM and galaxy filament (dDM, dgal). Points show individual galaxies with correspondingly coloured lines enclosing the central 50% and 90% in each environment. The thick black line and shaded band traces the running median of dDM in bins of dgal and its 1σ uncertainty. Middle: Cumulative distribution of galaxy distances from their nearest galaxy-filament spine. The black line represents the full galaxy sample, corresponding to the dark grey histogram in the background. Coloured lines split the galaxy population into the same five environments as in the left-hand panel (histograms omitted for clarity). For comparison, the distribution of galaxy distances from their nearest DM-filament is shown by the grey line and histogram. Right: Fraction of galaxies in each of the five environments as a function of distance from their nearest galaxy-filament spine. Shaded bands indicate binomial 68% confidence intervals (Cameron 2011). Thin dotted vertical lines delineate the five distance bins; each point is plotted at the median distance of the galaxies that it represents. Horizontal dash-dotted lines show the overall fraction of galaxies in each environment. Distances to the two filament networks are only weakly correlated, but galaxies closer to a galaxy-filament are generally more likely to be part of a thick DM-filament.
Current usage metrics show cumulative count of Article Views (full-text article views including HTML views, PDF and ePub downloads, according to the available data) and Abstracts Views on Vision4Press platform.
Data correspond to usage on the plateform after 2015. The current usage metrics is available 48-96 hours after online publication and is updated daily on week days.
Initial download of the metrics may take a while.