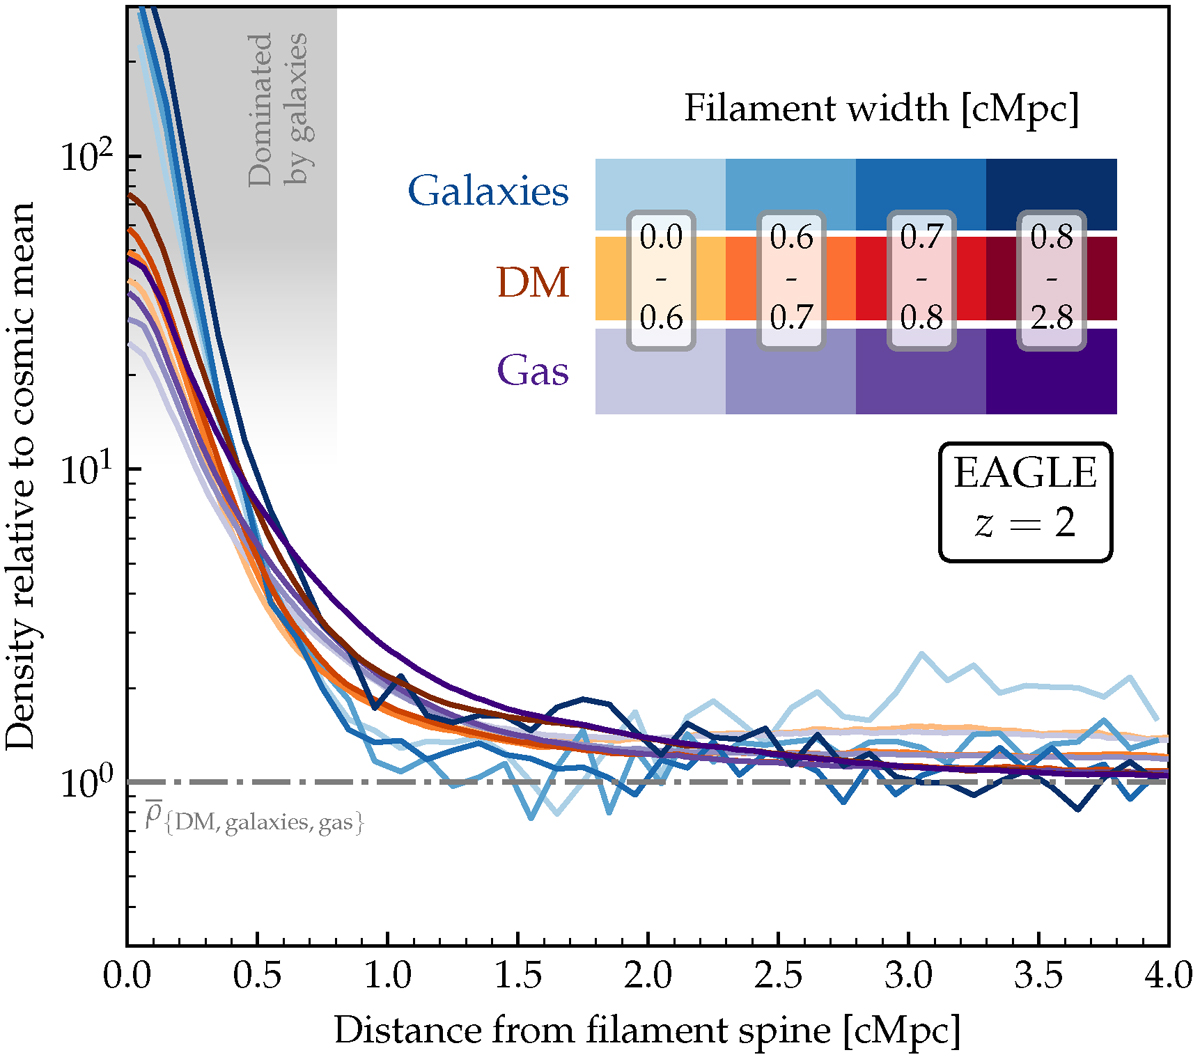
Fig. B.2.
Download original image
Density profiles around filaments at z = 2, in analogy to what is shown in Fig. 9 for z = 0. Galaxy, DM, and gas profiles are shown in blue, orange, and purple, each normalised to their respective cosmic mean (grey dash-dotted line). The grey shaded area marks overdensities ≳10 that are dominated by galaxies within the filaments. Different colour shades represent different quartiles in filament width. The profiles are qualitatively similar to those at z = 0, with some minor quantitative differences.
Current usage metrics show cumulative count of Article Views (full-text article views including HTML views, PDF and ePub downloads, according to the available data) and Abstracts Views on Vision4Press platform.
Data correspond to usage on the plateform after 2015. The current usage metrics is available 48-96 hours after online publication and is updated daily on week days.
Initial download of the metrics may take a while.