Fig. 4.
Download original image
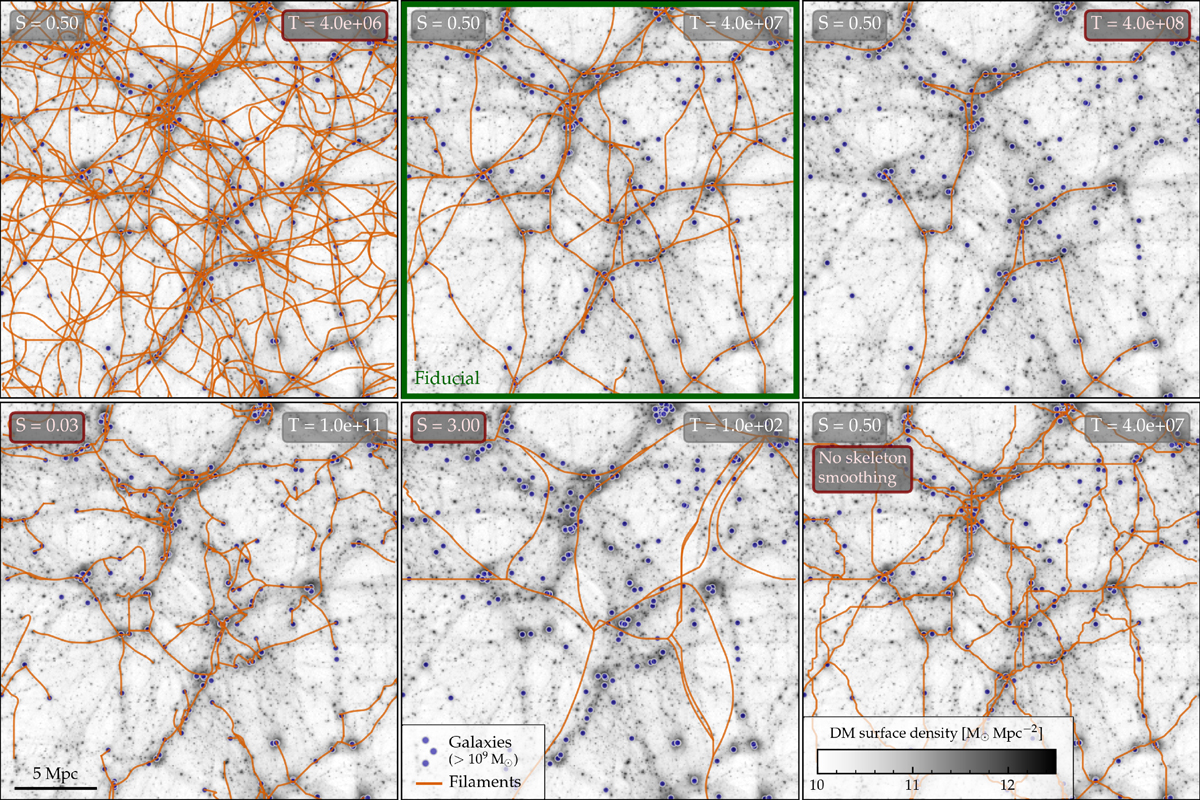
Sensitivity of the filament network to parameter choices. Each panel shows a full projection through the EAGLE-Ref25 simulation, with filaments in orange, galaxies (Mstar > 109 M⊙) in indigo, and the projected DM density as greyscale image in the background. Deviations from our fiducial parameters are highlighted in red. In the top row, the middle panel (green frame) uses our fiducial values, while the left- and right-hand panels adopt a 10× lower and higher DisPerSE persistence threshold T, respectively. In the bottom row, the left-hand and middle panels instead show the effect of smoothing the DM field with a smaller or larger kernel S than our fiducial choice. Finally, the bottom-right panel shows the filaments without smoothing the spines. Of the six networks shown here, only our fiducial choice traces the DM filaments adequately.
Current usage metrics show cumulative count of Article Views (full-text article views including HTML views, PDF and ePub downloads, according to the available data) and Abstracts Views on Vision4Press platform.
Data correspond to usage on the plateform after 2015. The current usage metrics is available 48-96 hours after online publication and is updated daily on week days.
Initial download of the metrics may take a while.