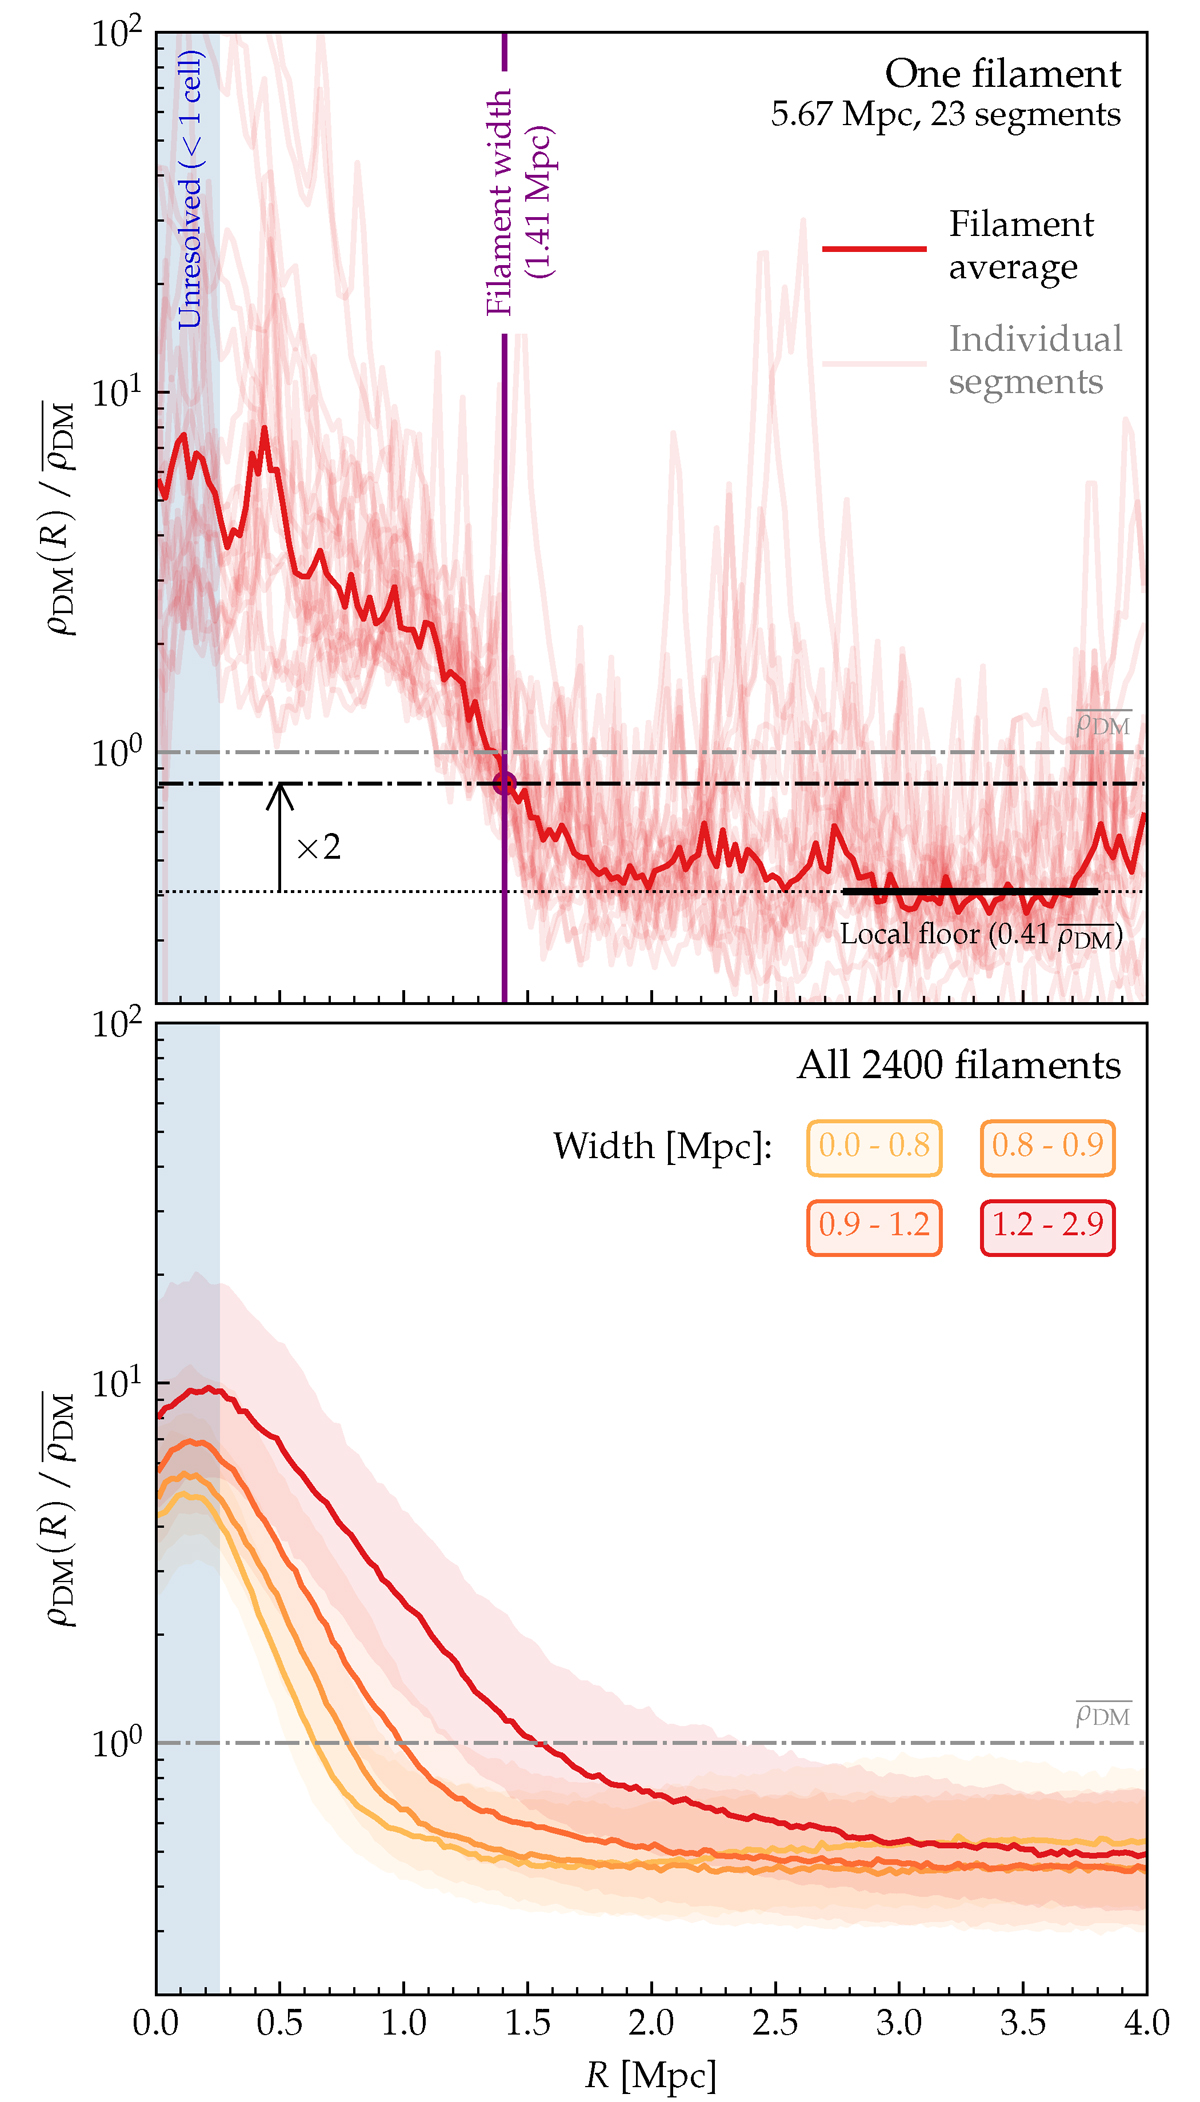
Fig. 6.
Download original image
Dark matter density profiles around filaments in EAGLE. Top: Density profiles for the individual segments of one filament (thin red lines) and their stacked median, the representative profile of the filament (thick red line). The dotted black line represents the local background density, with the solid portion indicating the window where it is measured. The filament width (vertical purple line) is defined as the point where the profile drops below twice this value (black dash-dotted line); here it is close to the cosmic mean (grey dash-dotted line). Bottom: Median-stacked profiles of all filaments in bins of their width (different colours). Shaded bands enclose the central 50% of filaments in each bin. All stacks decline steadily to a common floor at around half the cosmic mean, with a clear correlation between the width and central density.
Current usage metrics show cumulative count of Article Views (full-text article views including HTML views, PDF and ePub downloads, according to the available data) and Abstracts Views on Vision4Press platform.
Data correspond to usage on the plateform after 2015. The current usage metrics is available 48-96 hours after online publication and is updated daily on week days.
Initial download of the metrics may take a while.