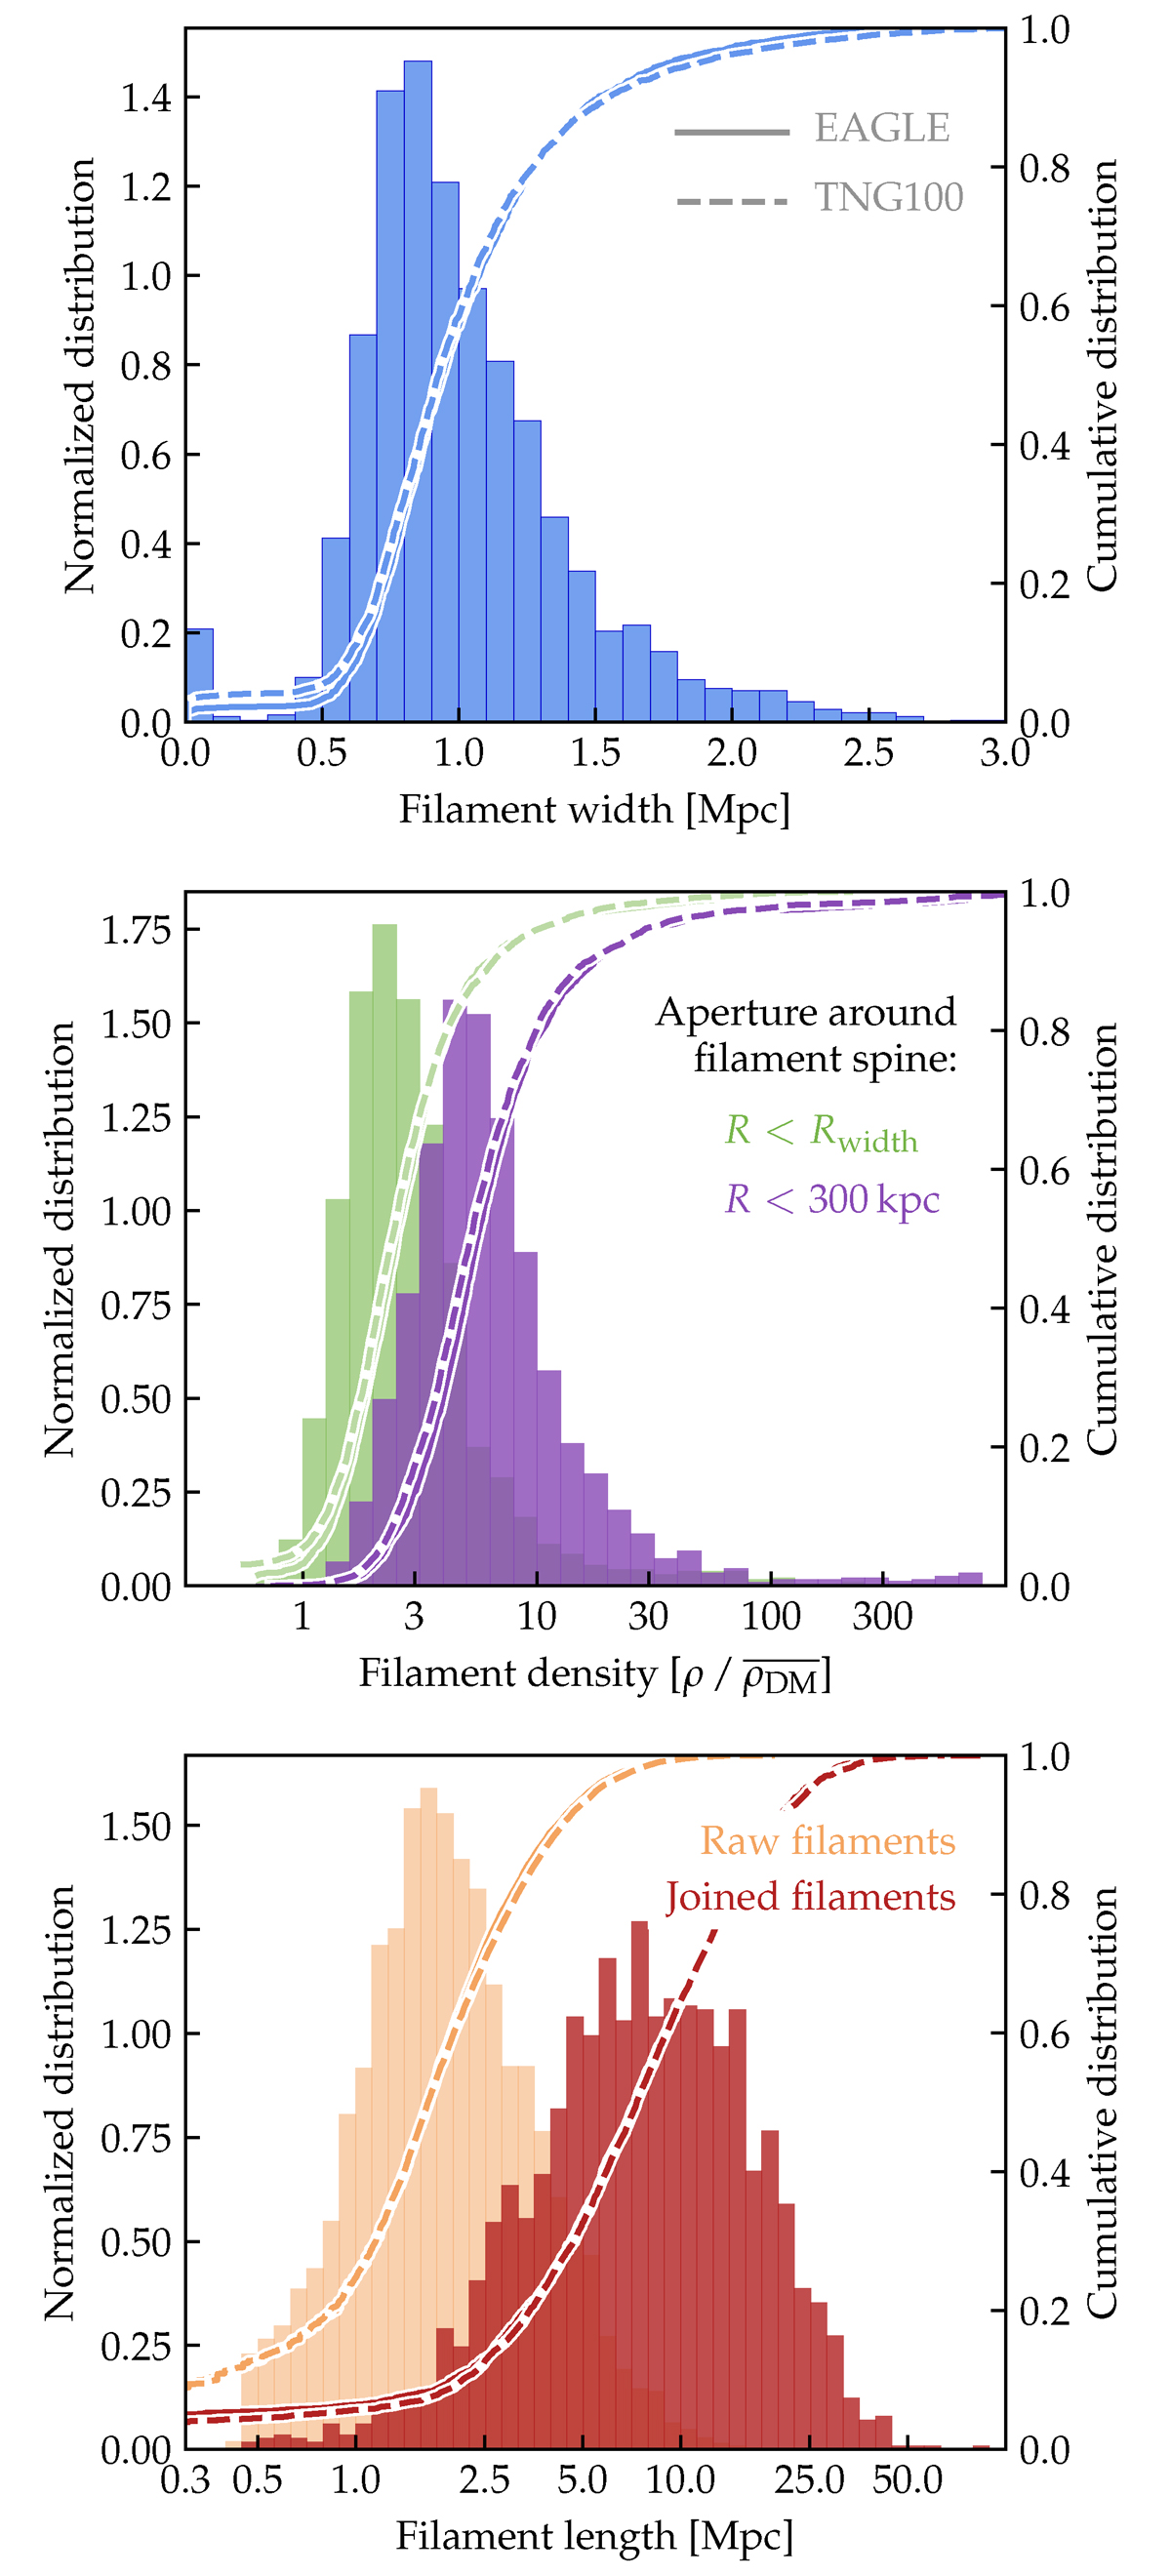
Fig. 7.
Download original image
Filament properties at z = 0 for EAGLE and TNG100. Top panel: Filament widths, defined as described in the text and illustrated in Fig. 6. Middle panel: Average dark matter density within the filament width (green) and the central 300 kpc from the spine (purple). Bottom panel: Lengths of the ‘raw’ filaments as identified by DisPerSE (light red) and the combined filaments after our joining step (dark red; see Sect. 3.3.6). In all cases, histograms represent the differential distribution for EAGLE, while the solid and dashed lines show the cumulative distributions for EAGLE and TNG100, respectively. The two simulations agree almost perfectly, with typical values of ∼1 Mpc for width, ∼10× overdensity within 300 kpc, and ∼10 Mpc length for the joined filaments.
Current usage metrics show cumulative count of Article Views (full-text article views including HTML views, PDF and ePub downloads, according to the available data) and Abstracts Views on Vision4Press platform.
Data correspond to usage on the plateform after 2015. The current usage metrics is available 48-96 hours after online publication and is updated daily on week days.
Initial download of the metrics may take a while.