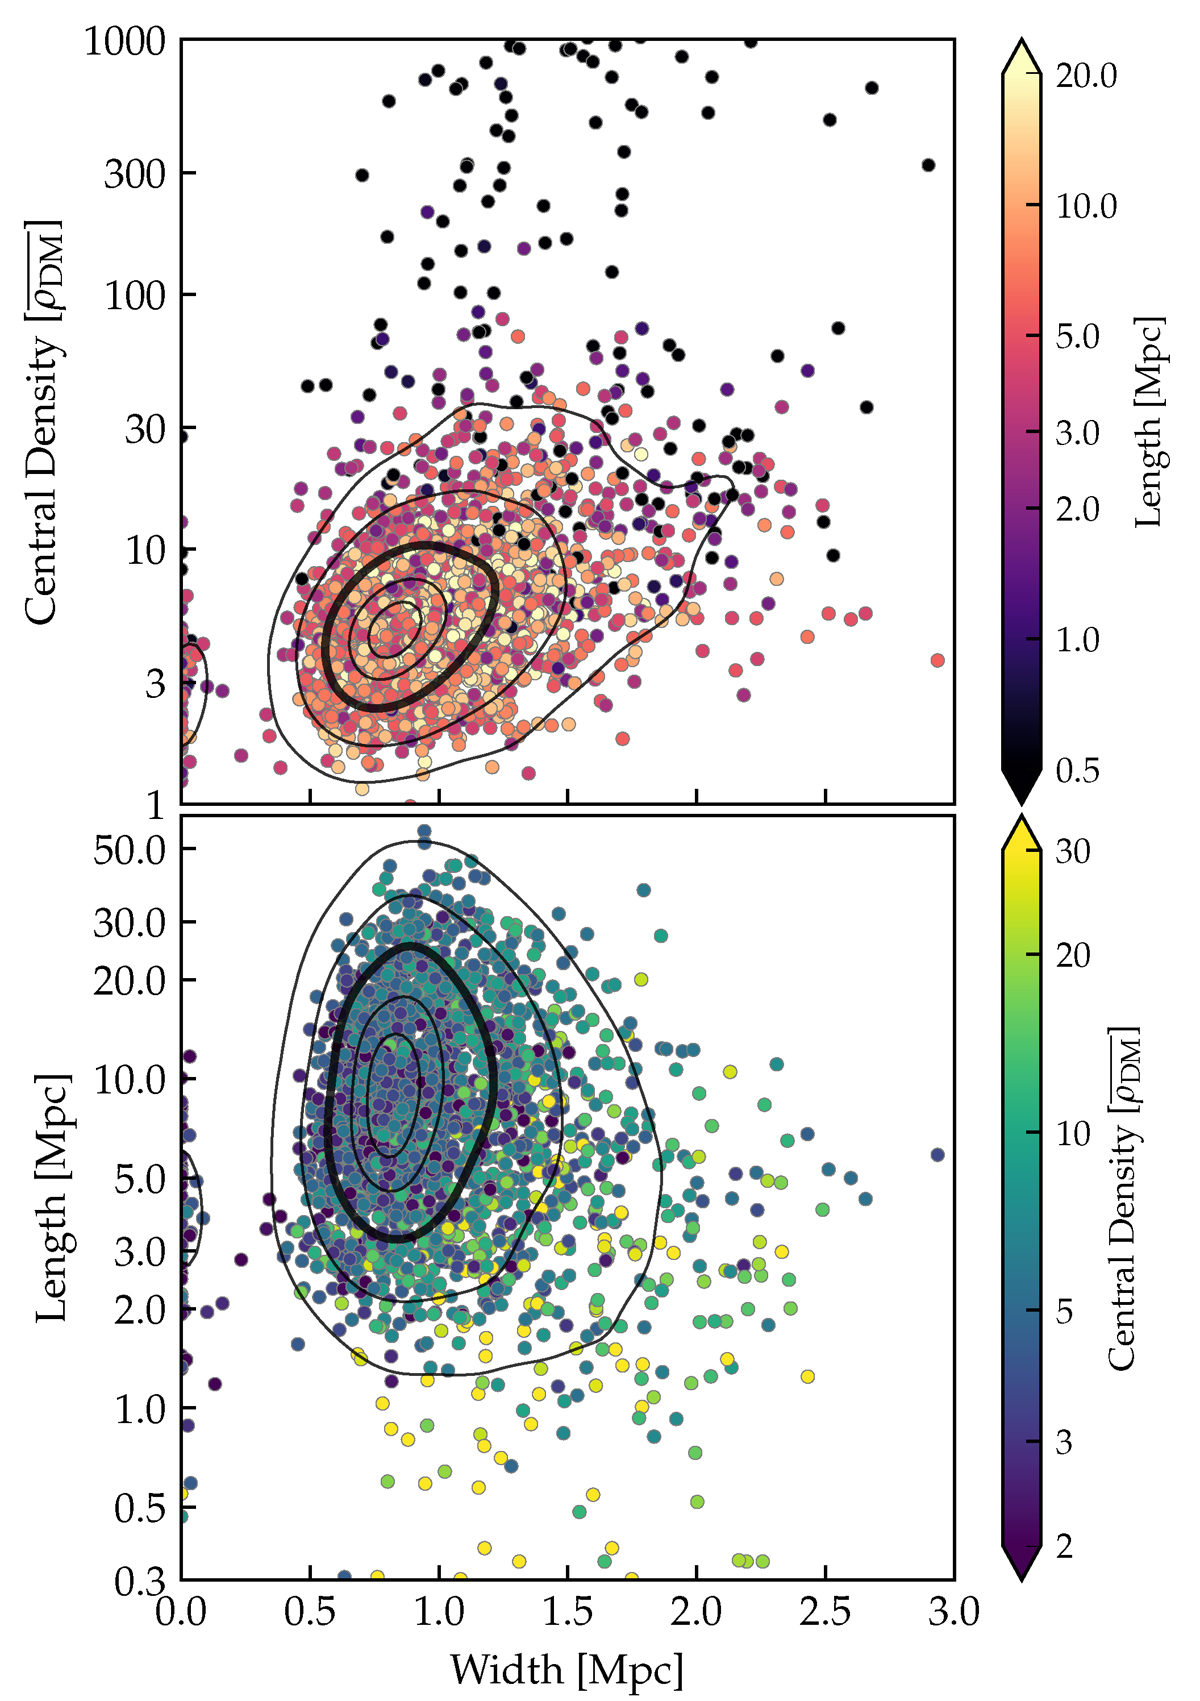
Fig. 8.
Download original image
Correlation between filament width, length, and central density (within 300 kpc from the spine) for EAGLE at z = 0. Top panel: Density vs. width coloured by length. Bottom panel: Length vs. width coloured by density. For both panels, points represent individual filaments, while black lines enclose the central 10%, 25%, 50% (thick), 75%, and 90% of points. There is a modest correlation between density and length, while length and width are largely independent apart from outliers with density ≳ 30× the cosmic mean.
Current usage metrics show cumulative count of Article Views (full-text article views including HTML views, PDF and ePub downloads, according to the available data) and Abstracts Views on Vision4Press platform.
Data correspond to usage on the plateform after 2015. The current usage metrics is available 48-96 hours after online publication and is updated daily on week days.
Initial download of the metrics may take a while.