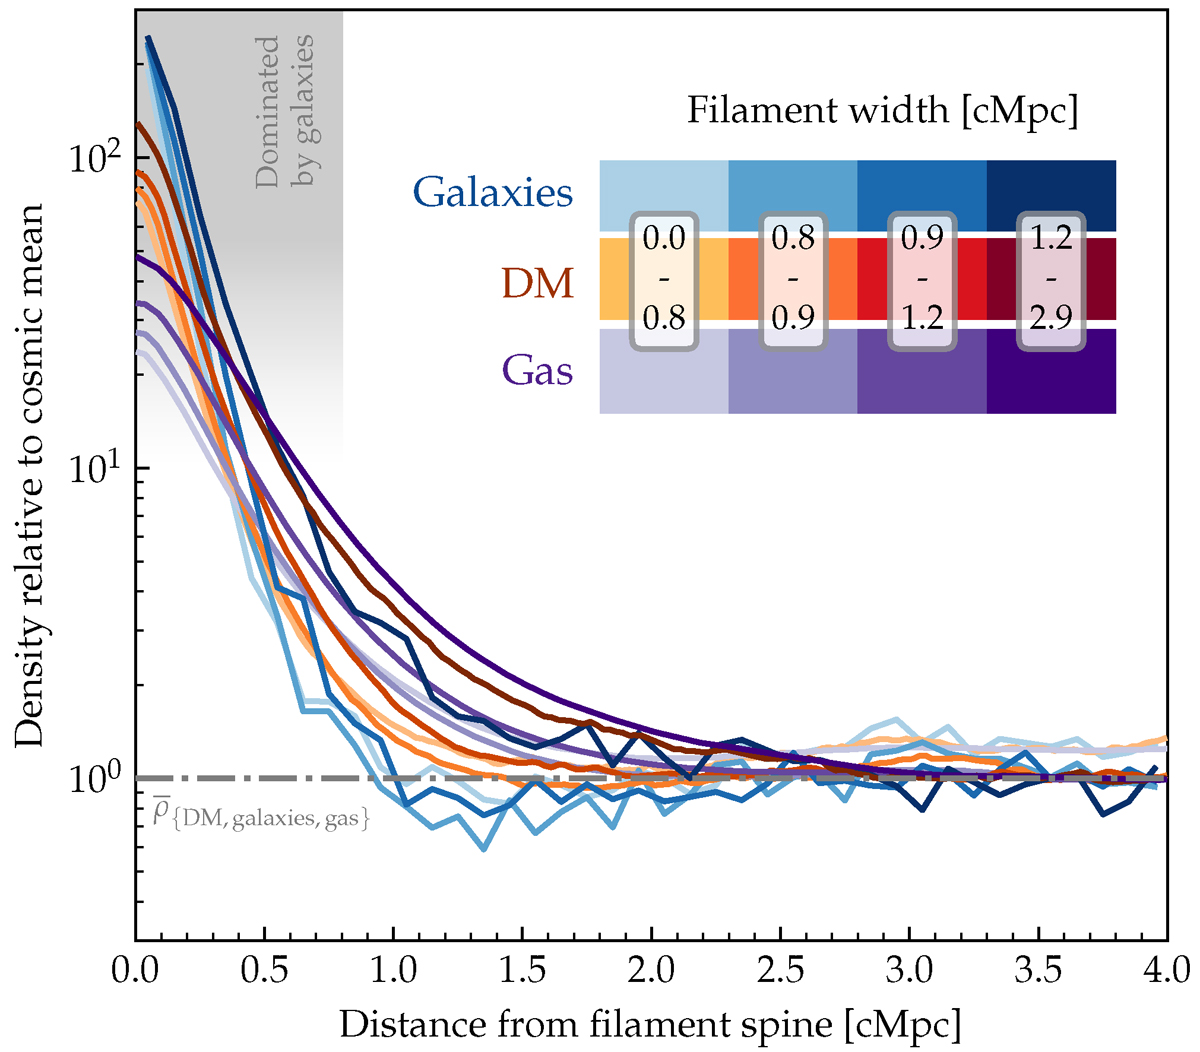
Fig. 9.
Download original image
Mean-averaged density profiles of galaxies, dark matter, and gas around filaments in EAGLE at z = 0. Different shades represent different filament width quartiles as indicated. All profiles are mean-averaged across the relevant filament segments and normalised to their respective cosmic mean (grey dash-dotted line). The different profiles agree broadly with each other, with the galaxies most concentrated near the filament spine while the gas is most extended. Even in the thickest quartile, the average profiles reach the cosmic mean at < 3 Mpc from the spine.
Current usage metrics show cumulative count of Article Views (full-text article views including HTML views, PDF and ePub downloads, according to the available data) and Abstracts Views on Vision4Press platform.
Data correspond to usage on the plateform after 2015. The current usage metrics is available 48-96 hours after online publication and is updated daily on week days.
Initial download of the metrics may take a while.