Fig. 1.
Download original image
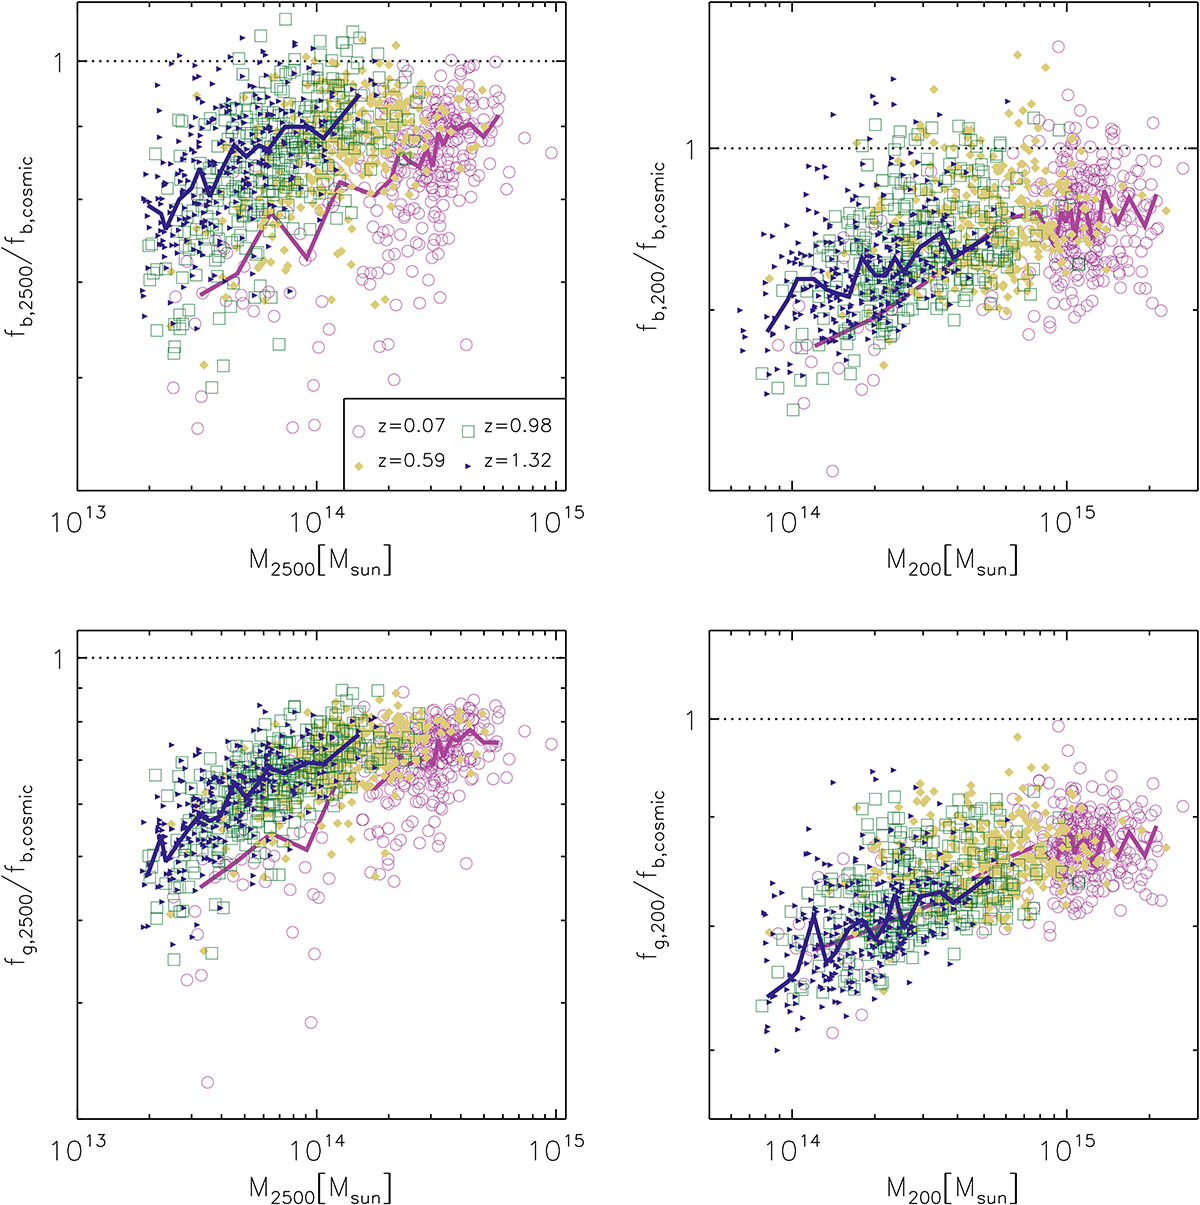
Baryon fraction (top panels) and hot-gas fraction (bottom panels) relative to the cosmic fraction versus the cluster mass within Δ = 2500 (left panels) and Δ = 200 (right panels). Data for z = 0.07 (pink circles), z = 0.59 (yellow diamonds), z = 0.98 (green squares), and z = 1.32 (navy triangles) are shown. The median values of the z = 0.07 and z = 1.32 subsamples are shown with a solid line. For reference: in both panels the maximum value of the y-axis is 1.1 and the horizontal line marks the cosmic baryon fraction.
Current usage metrics show cumulative count of Article Views (full-text article views including HTML views, PDF and ePub downloads, according to the available data) and Abstracts Views on Vision4Press platform.
Data correspond to usage on the plateform after 2015. The current usage metrics is available 48-96 hours after online publication and is updated daily on week days.
Initial download of the metrics may take a while.