Open Access
Fig. E.1.
Download original image
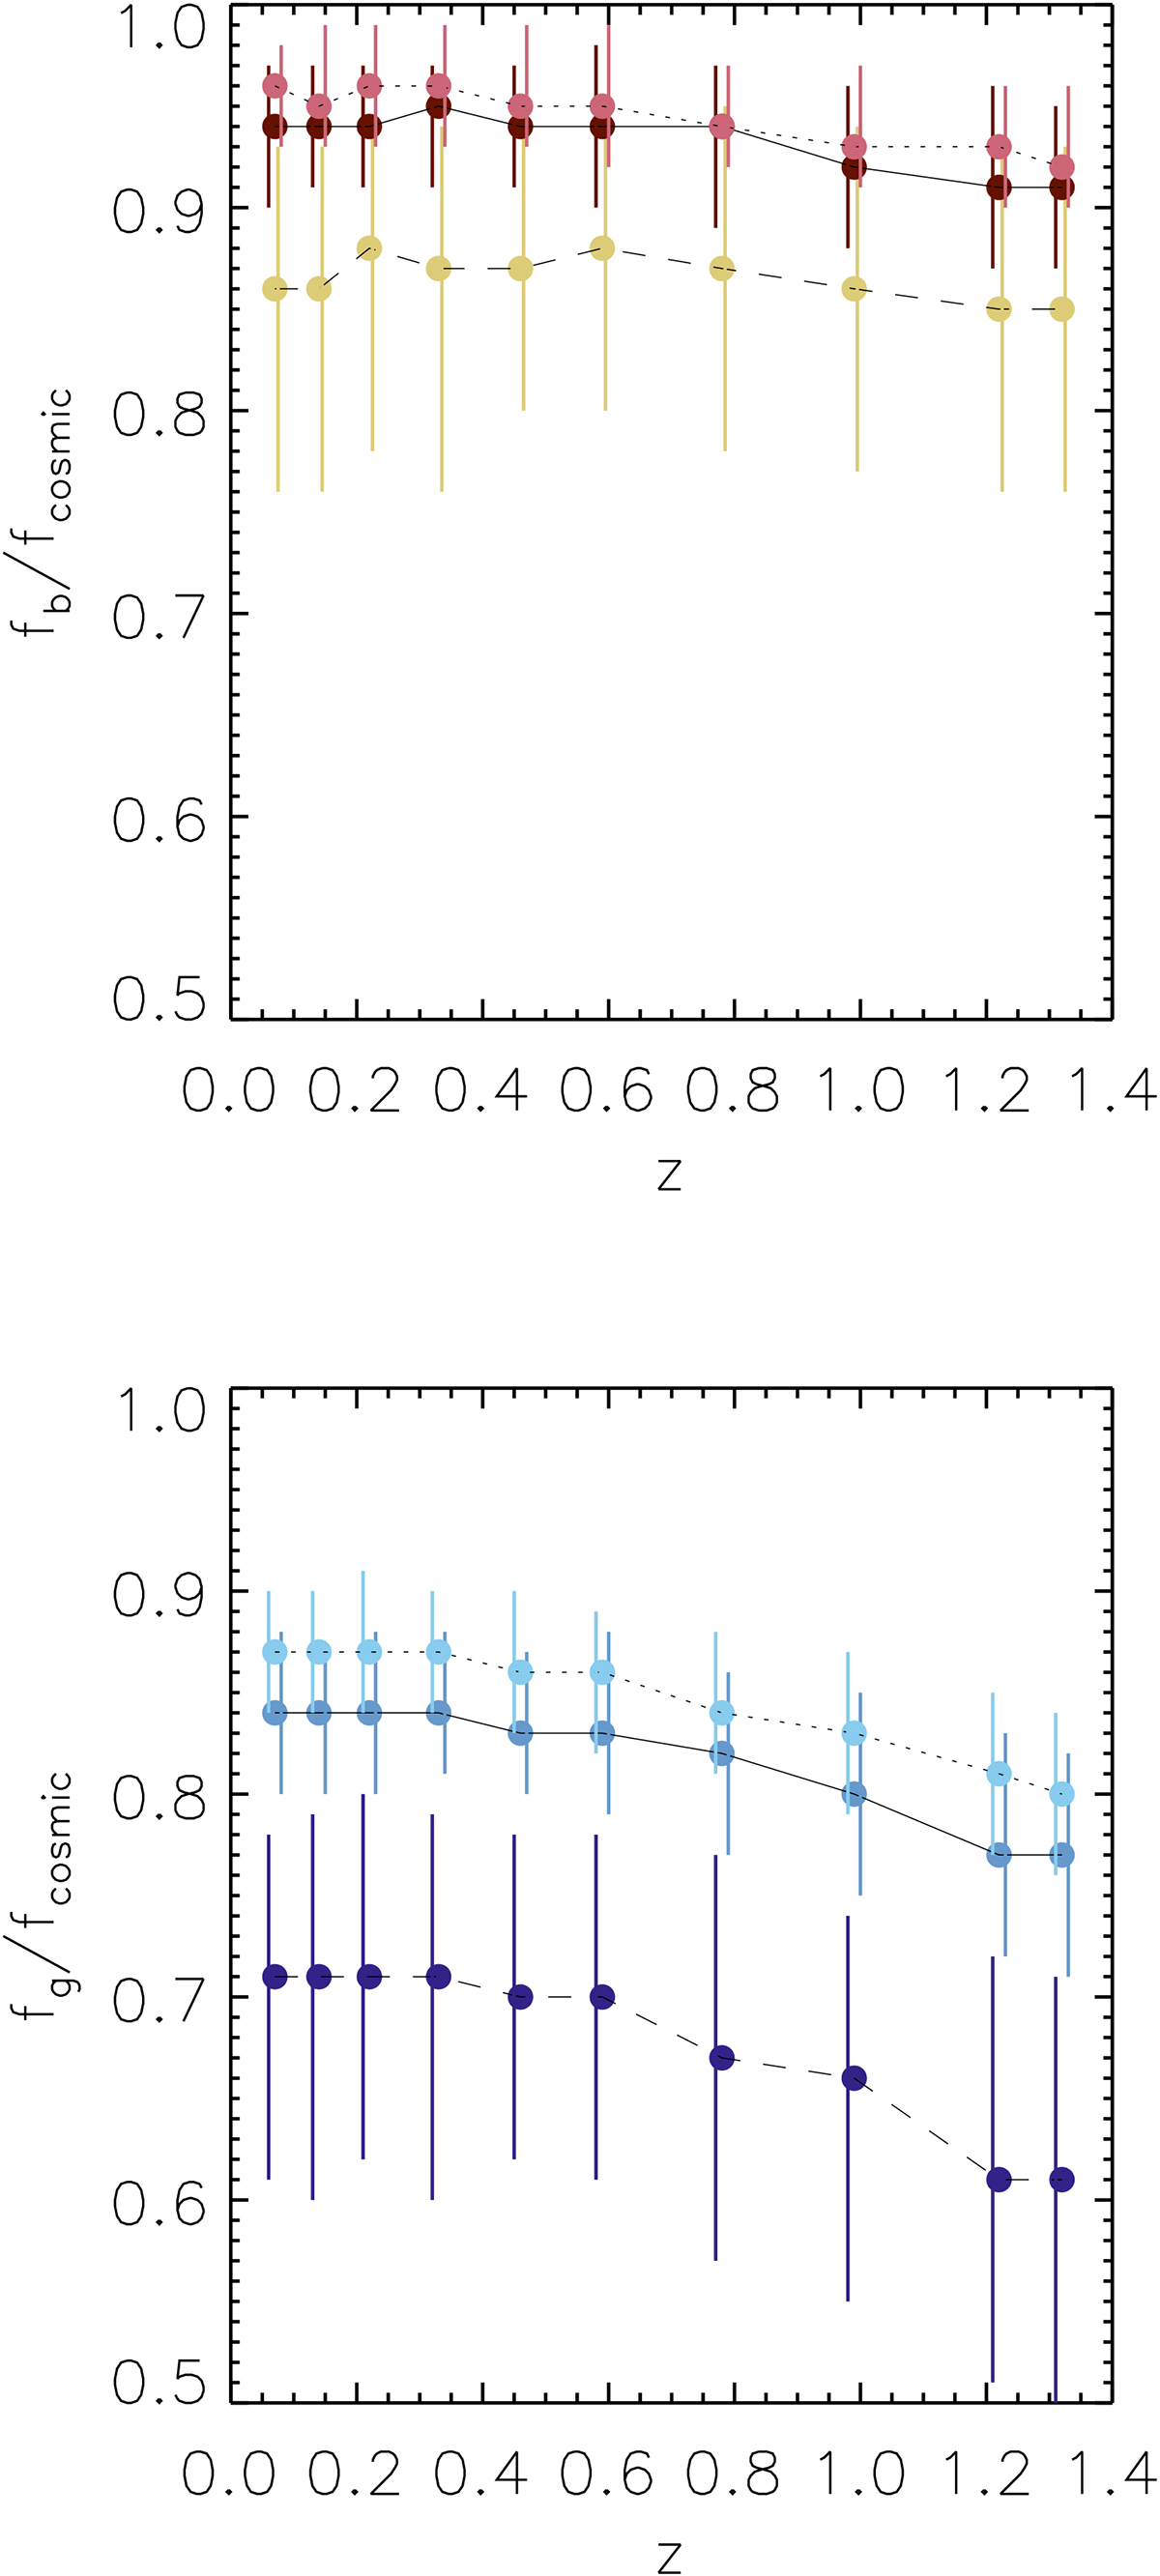
Median values of the relative baryon fractions (top panel) and gas fractions (bottom panel) as function of redshift computed at R2500 (in mustard and navy colors)), R500 (in dark-red and medium-blue colors), and R200 (in salmon and light-blue colors). The error bars represent the 16th and 84th percentiles.
Current usage metrics show cumulative count of Article Views (full-text article views including HTML views, PDF and ePub downloads, according to the available data) and Abstracts Views on Vision4Press platform.
Data correspond to usage on the plateform after 2015. The current usage metrics is available 48-96 hours after online publication and is updated daily on week days.
Initial download of the metrics may take a while.