Fig. 4.
Download original image
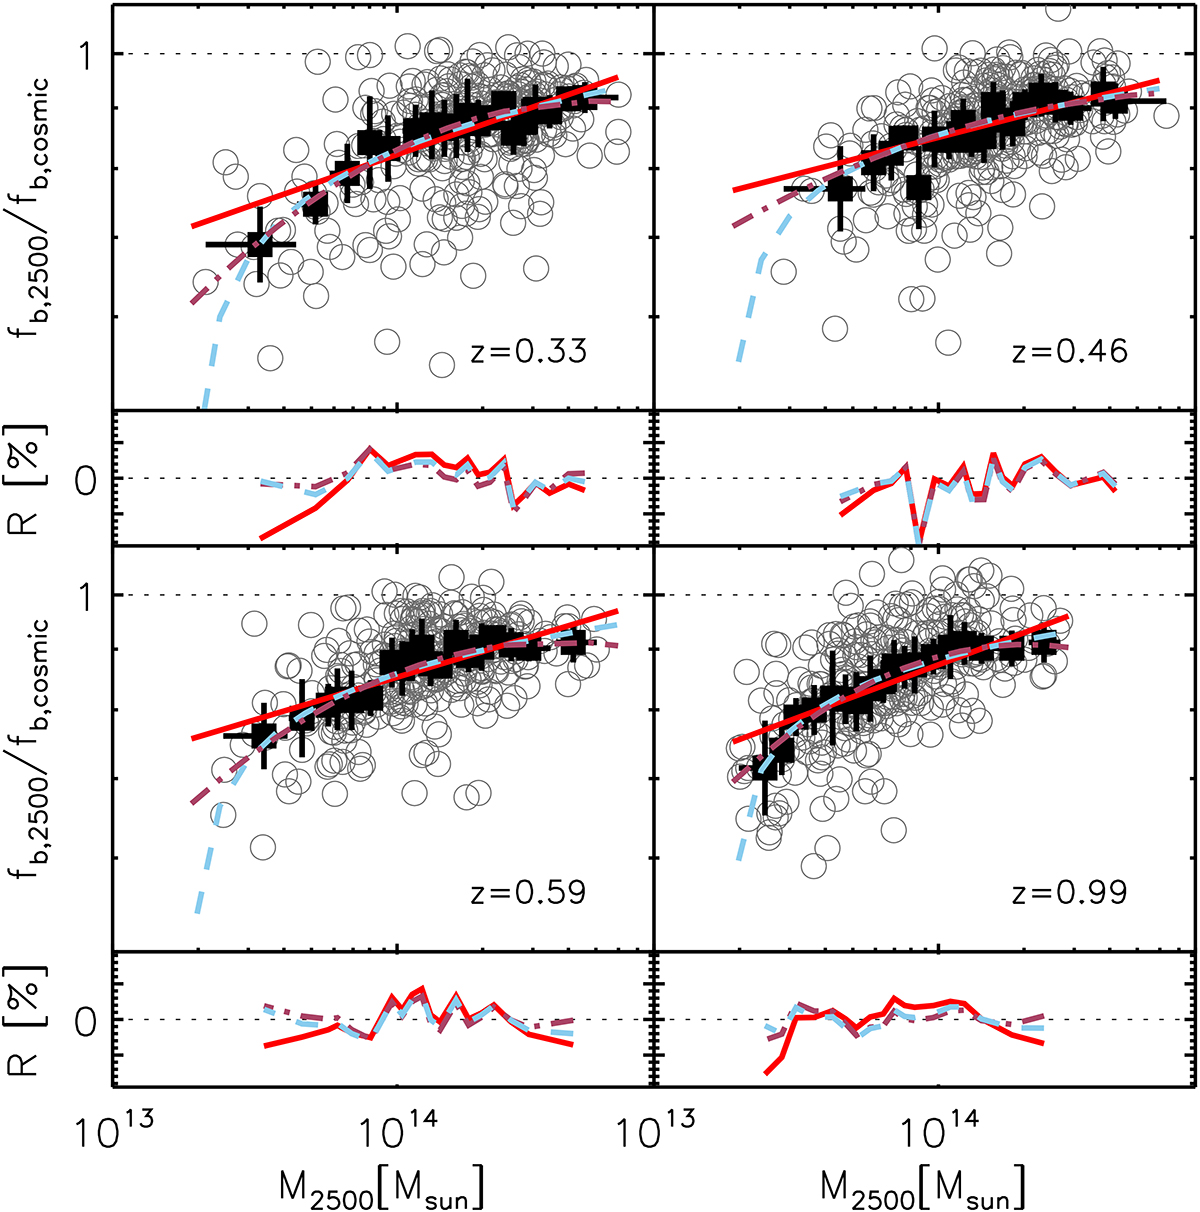
Best-fit functions of Eq. (2) (solid red line), Eq. (3) (dot-dashed brown line), and Eq. (4) (dashed light-blue line) at the four redshifts specified in each panel. Individual clusters are shown with empty gray circles, while the median values are shown with black squares. Error bars indicate σμ and ση. The residuals of the best-fit functions with respect to the median values are shown at the bottom of each panel.
Current usage metrics show cumulative count of Article Views (full-text article views including HTML views, PDF and ePub downloads, according to the available data) and Abstracts Views on Vision4Press platform.
Data correspond to usage on the plateform after 2015. The current usage metrics is available 48-96 hours after online publication and is updated daily on week days.
Initial download of the metrics may take a while.