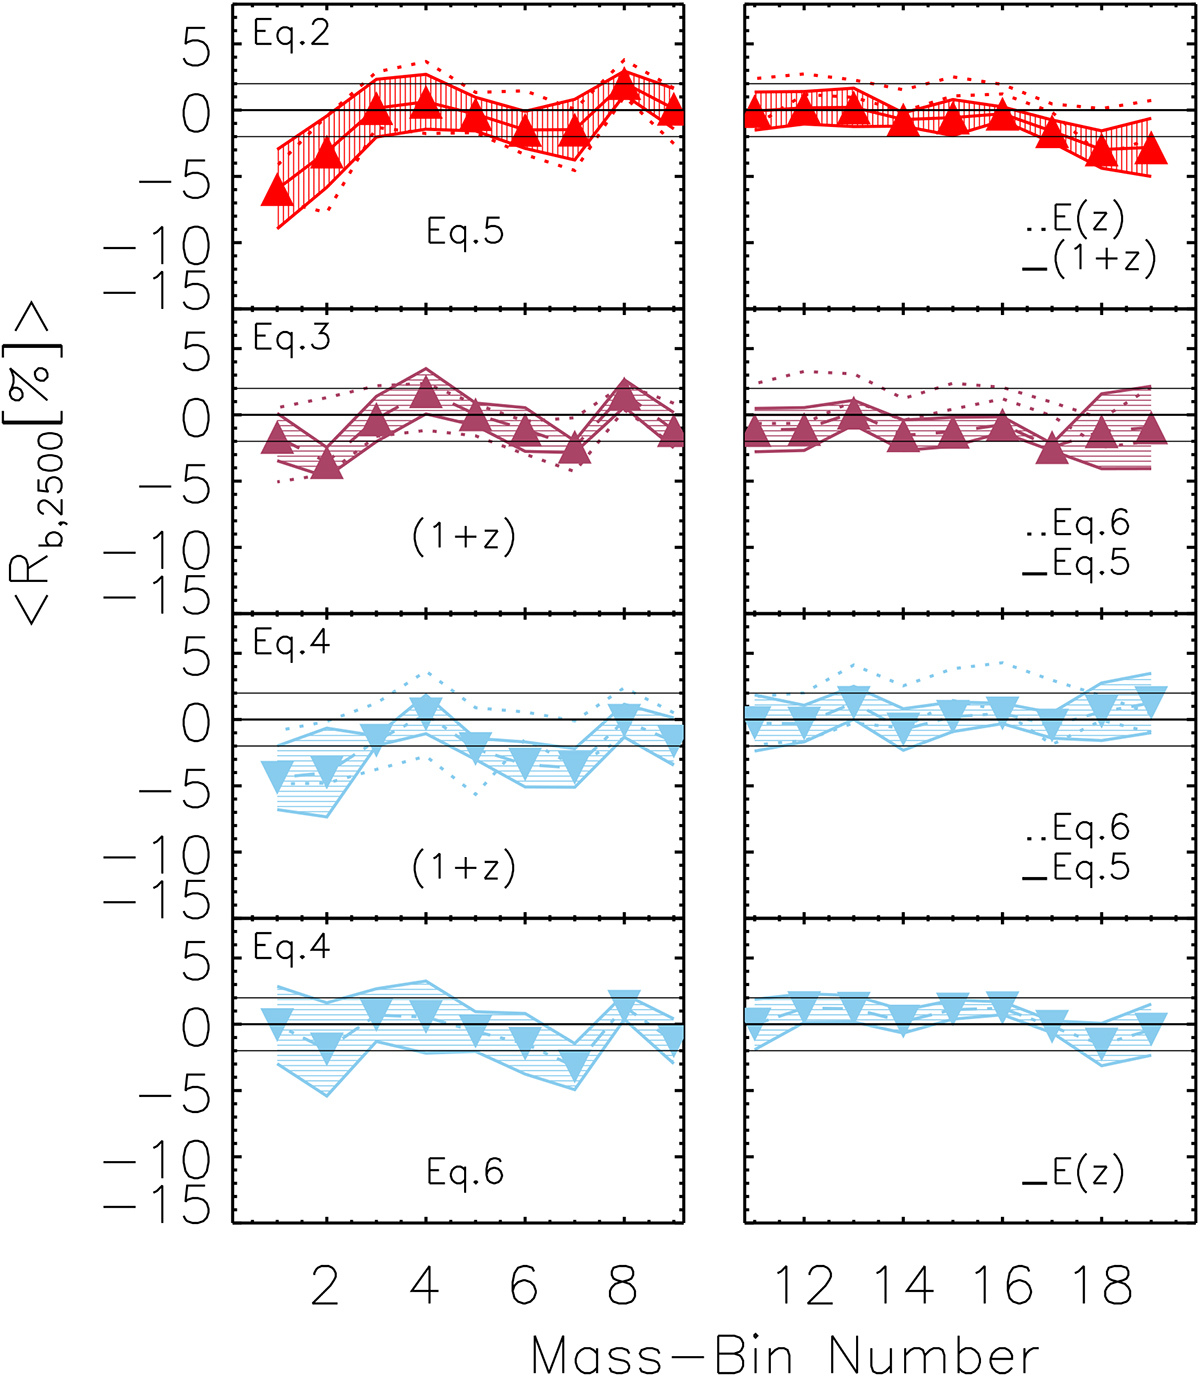
Fig. 5.
Download original image
Average and 1σ deviation of the residuals of the baryon fraction at R2500 at fixed mass-bin number. Equations (2), (3), and (4) are shown in the first, second, and third panel from the top, respectively, once the evolution is parametrized through (1 + z) as a shift in the normalization (Eq. (5)). In the first panel, the dotted lines represent the E(z) evolution for the linear fit and in the second and third panels they represent the residuals of Eq. (6). The bottom panel shows the results of using Eq. (4), but after adopting E(z) in the expression for the redshift dependence provided by Eq. (6). Residuals have been aligned toward the first bin in the left panels and toward the last bin in the right panels.
Current usage metrics show cumulative count of Article Views (full-text article views including HTML views, PDF and ePub downloads, according to the available data) and Abstracts Views on Vision4Press platform.
Data correspond to usage on the plateform after 2015. The current usage metrics is available 48-96 hours after online publication and is updated daily on week days.
Initial download of the metrics may take a while.