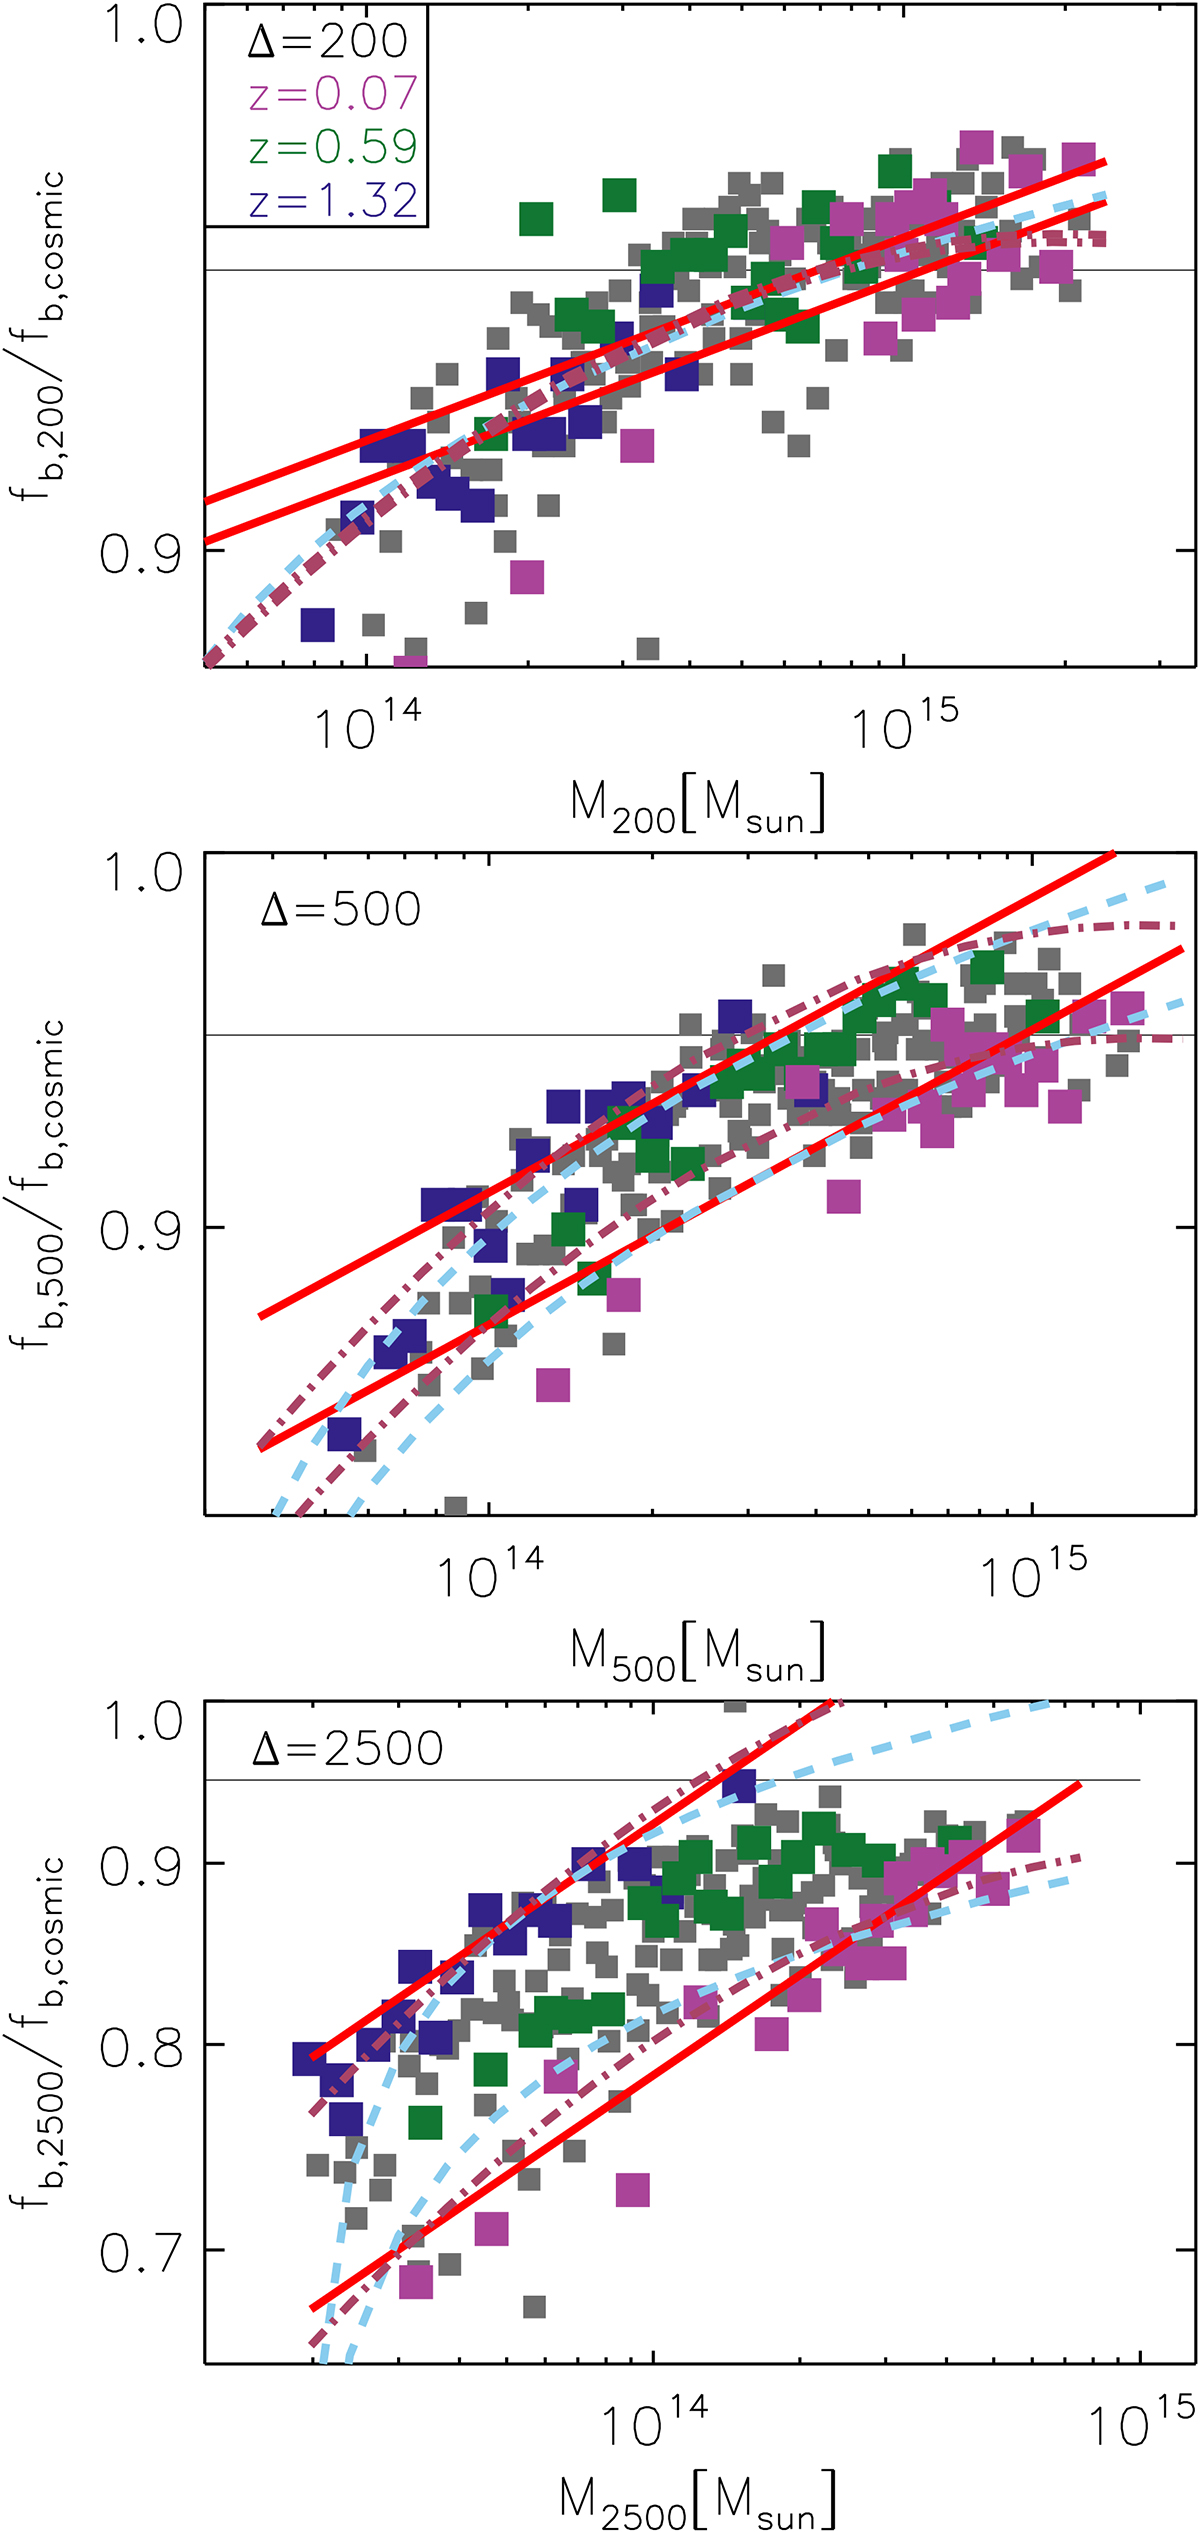
Fig. 6.
Download original image
Median baryon fraction at all redshifts (plotted in gray) and at the three overdensities: 200 (top panel), 500 (central panel), and 2500 (bottom panel). Subsamples at z = 0.07, z = 0.59, and z = 1.32 are in dark pink, green, and blue, respectively. Solid red, dot-dashed brown, and dashed light-blue lines represent the best-fit results using the (1 + z) dependence as in Eq. (5) for the three functional forms at z = 0 and z = 1.32 (parameters in Table 2). The horizontal line, which is equal to 0.95, serves only as a reference to appreciate the change in the y-axis range and it is in all three panels.
Current usage metrics show cumulative count of Article Views (full-text article views including HTML views, PDF and ePub downloads, according to the available data) and Abstracts Views on Vision4Press platform.
Data correspond to usage on the plateform after 2015. The current usage metrics is available 48-96 hours after online publication and is updated daily on week days.
Initial download of the metrics may take a while.