Open Access
Fig. 7.
Download original image
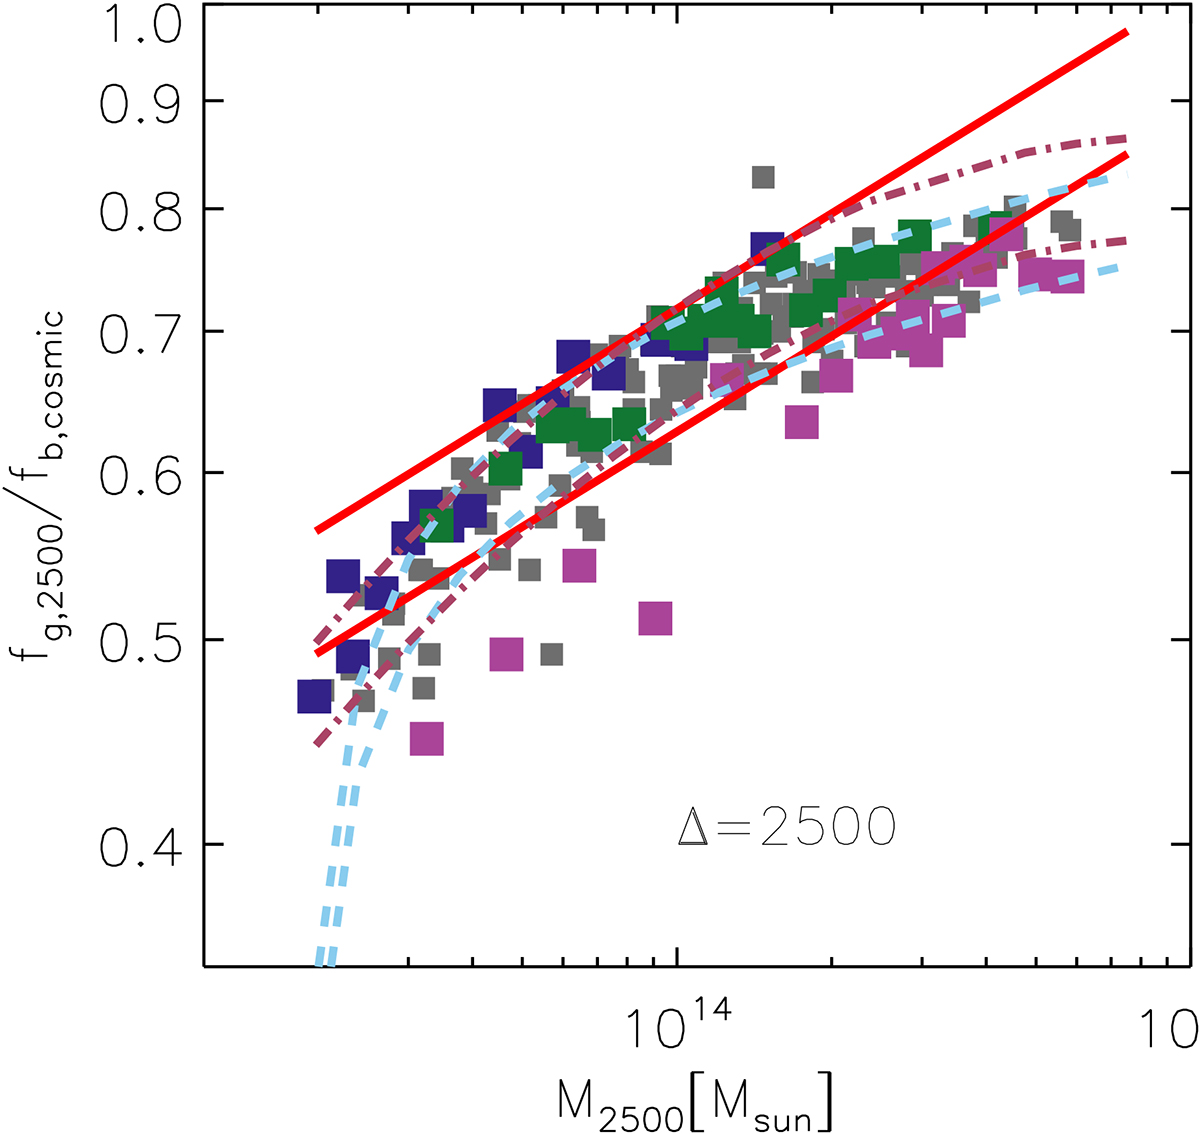
Medians of hot-gas fractions at R2500. Symbols and colors have similar meaning as in Fig. 6. The solid red, dot-dashed brown, and dashed light-blue lines represent the best-fit results of the horizontal shifting (parameters in top half of Table 4) for z = 0.07 (curves with lower normalization) and z = 1.32.
Current usage metrics show cumulative count of Article Views (full-text article views including HTML views, PDF and ePub downloads, according to the available data) and Abstracts Views on Vision4Press platform.
Data correspond to usage on the plateform after 2015. The current usage metrics is available 48-96 hours after online publication and is updated daily on week days.
Initial download of the metrics may take a while.