Fig. 9.
Download original image
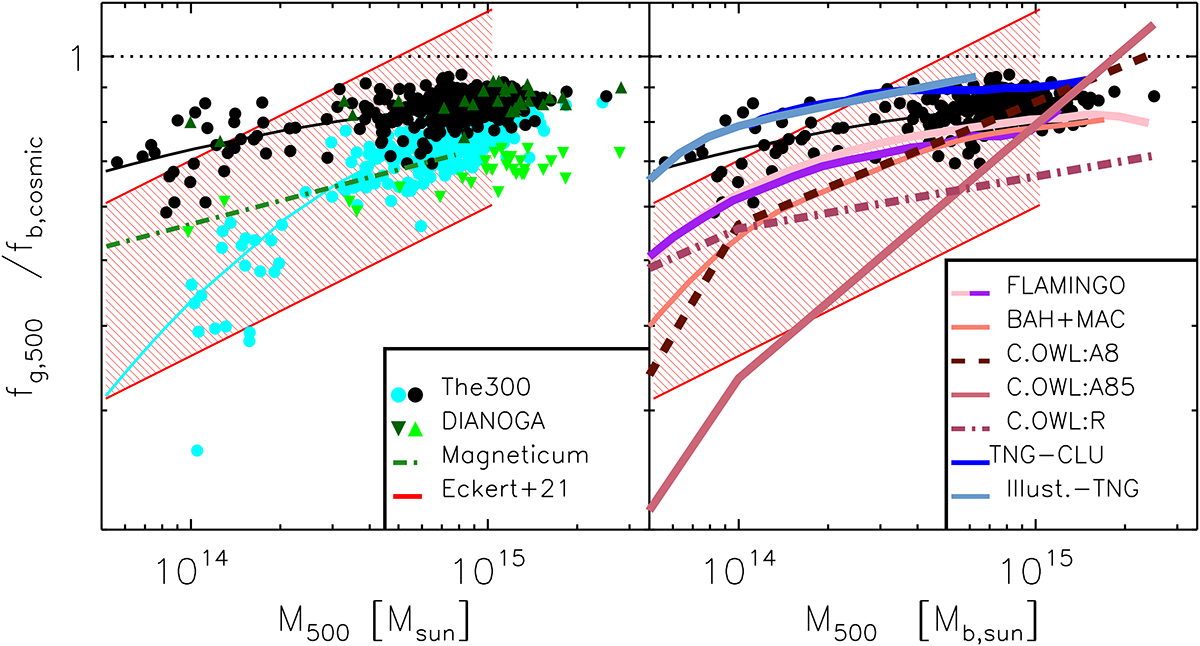
Comparison between different simulation sets for the hot-gas fraction relative to the cosmic baryon fraction within R500 versus the total cluster mass, M500, at z = 0. In both panels, the red band is the observational reference from Eckert et al. (2021) (as Fig. 2) and the empty gray circles show The300 simulated clusters used in this work. The left panel shows the relative hot-gas fraction from The300 simulated with GIZMO-SIMBA in cyan and the AGN and CSF models of the DIANOGA sets in dark and bright green triangles. The median values for TNG-Cluster are in blue; those for the largest and the highest resolution box of the FLAMINGO simulations are in pink and purple; the combination of the BAHAMAS and MACSIS samples is in orange. In the right panels, we report some best-fit forms: those for cosmo-OWL AGN8, AGN85, and reference model are in dark brown, brown, and light brown. The model for Illustris TNG is in light blue and that for the MAGNETICUM run in black (appropriate references in the text).
Current usage metrics show cumulative count of Article Views (full-text article views including HTML views, PDF and ePub downloads, according to the available data) and Abstracts Views on Vision4Press platform.
Data correspond to usage on the plateform after 2015. The current usage metrics is available 48-96 hours after online publication and is updated daily on week days.
Initial download of the metrics may take a while.