Fig. 2
Download original image
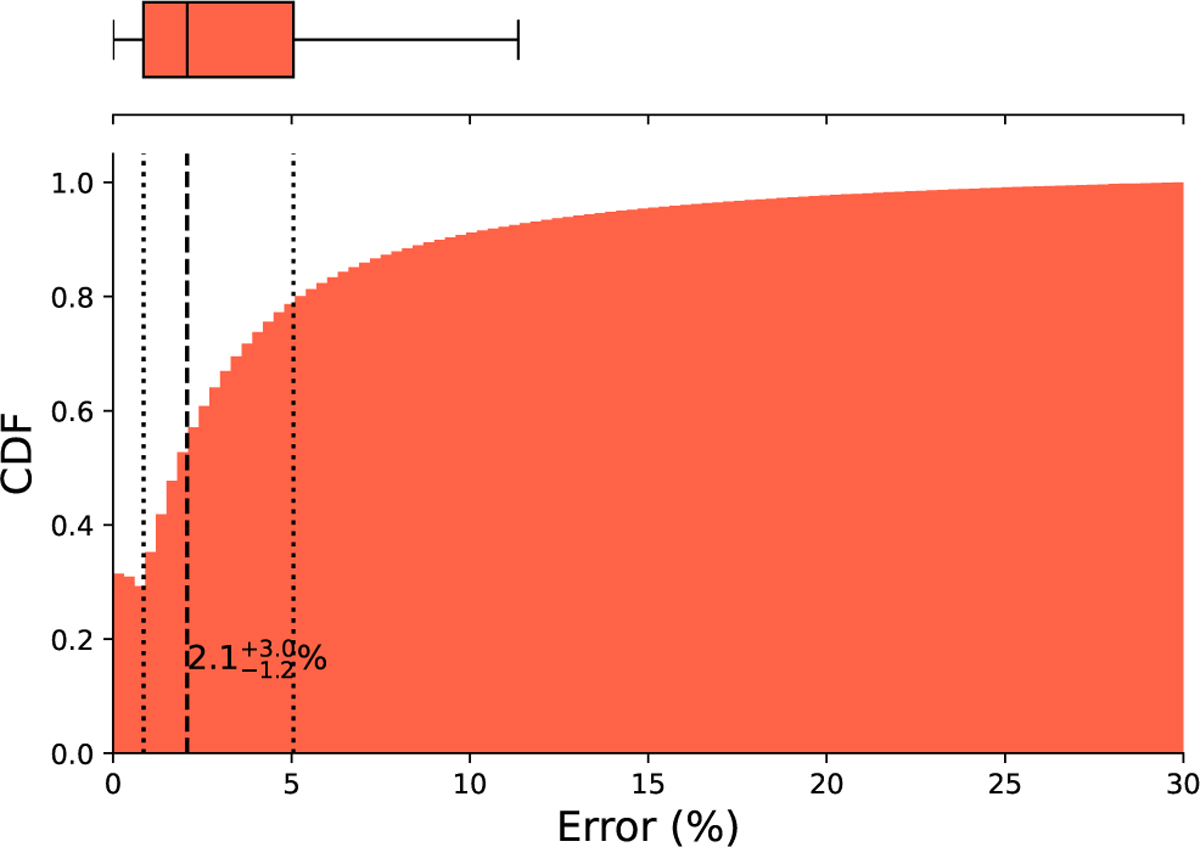
Cumulative absolute percentage error of the NN emulator for the CHEMPY simulator. The orange histogram shows the cumulative distribution of percentage errors with the vertical dashed line indicating the median and the vertical dotted lines indicating the first and third quartile. The box plot on the top of the plot extends from the first quartile to the third quartile of the data, with a line at the median. The whiskers extend from the box to the farthest data point lying within 1.5× the inter-quartile range from the box. The NN predicts abundances with an absolute percentage error far below typical observational errors.
Current usage metrics show cumulative count of Article Views (full-text article views including HTML views, PDF and ePub downloads, according to the available data) and Abstracts Views on Vision4Press platform.
Data correspond to usage on the plateform after 2015. The current usage metrics is available 48-96 hours after online publication and is updated daily on week days.
Initial download of the metrics may take a while.