Fig. 3
Download original image
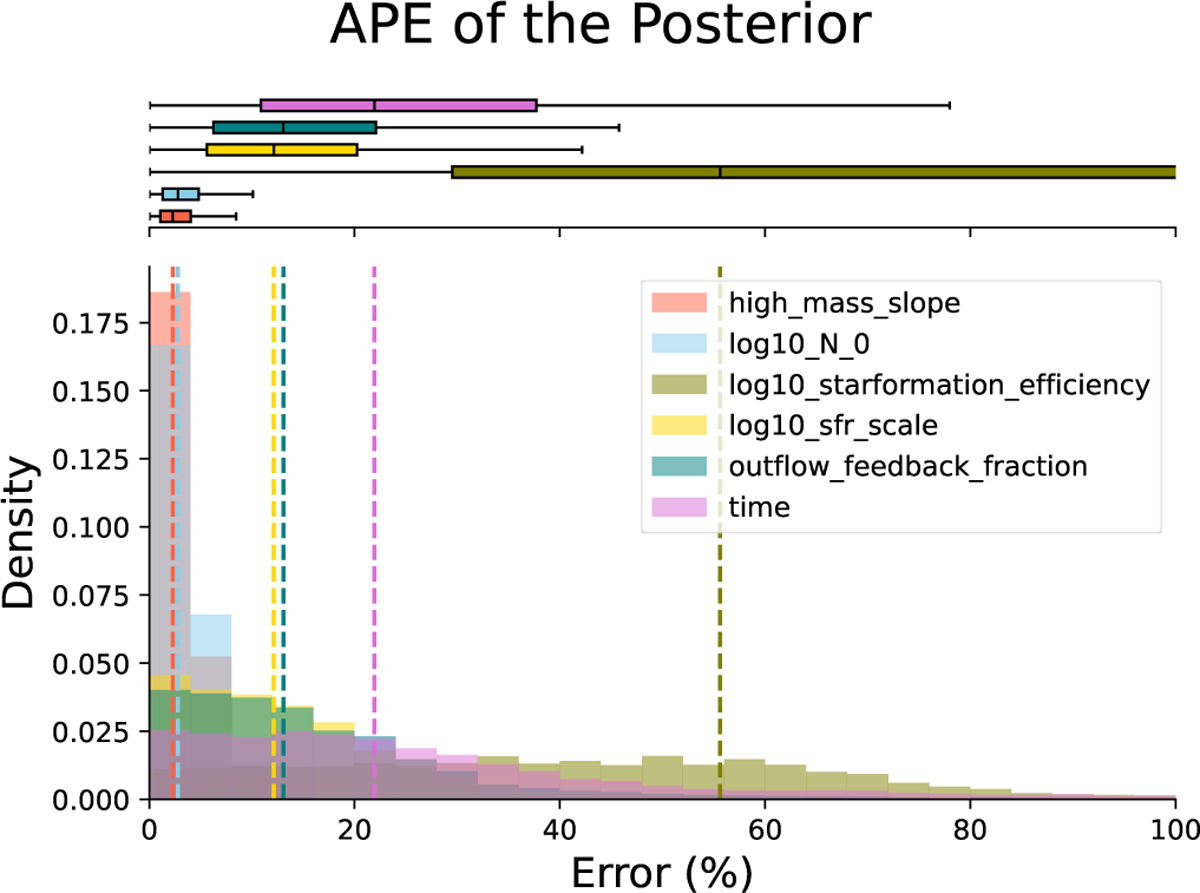
Absolute percentage error of the neural posterior density estimate for a single star. Different coloured histograms show the full error distribution for all six parameters of interest with the median values highlighted by the vertical dashed lines. The box plots show again the first and third quantiles with the median represented by a vertical line and the whiskers extending from the box to the farthest data point lying within 1.5× the inter-quartile range from the box. The global parameters of main interest for this work are shown by the light blue and red histogram.
Current usage metrics show cumulative count of Article Views (full-text article views including HTML views, PDF and ePub downloads, according to the available data) and Abstracts Views on Vision4Press platform.
Data correspond to usage on the plateform after 2015. The current usage metrics is available 48-96 hours after online publication and is updated daily on week days.
Initial download of the metrics may take a while.