Fig. 4
Download original image
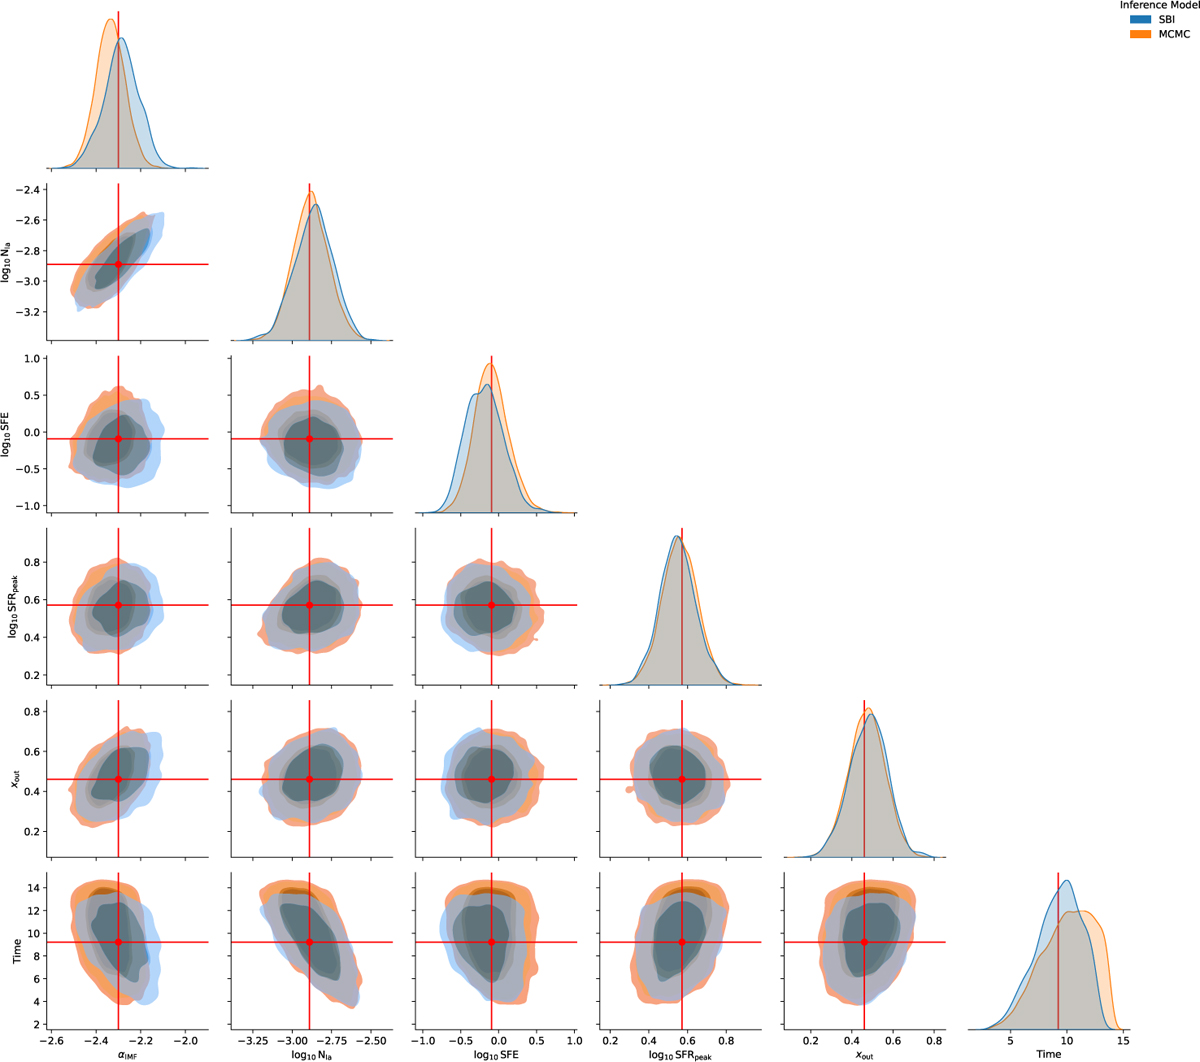
Corner plot of the posteriors for all six parameters for a single star from the validation set. The blue contours show a kde-estimate of the posterior from our SBI inference and the red dot and lines show the ground truth parameter values. The orange contours show results from a MCMC run on the same data. Blue/orange histograms on the diagonal show a kde estimate of the marginals.
Current usage metrics show cumulative count of Article Views (full-text article views including HTML views, PDF and ePub downloads, according to the available data) and Abstracts Views on Vision4Press platform.
Data correspond to usage on the plateform after 2015. The current usage metrics is available 48-96 hours after online publication and is updated daily on week days.
Initial download of the metrics may take a while.