Fig. A.1
Download original image
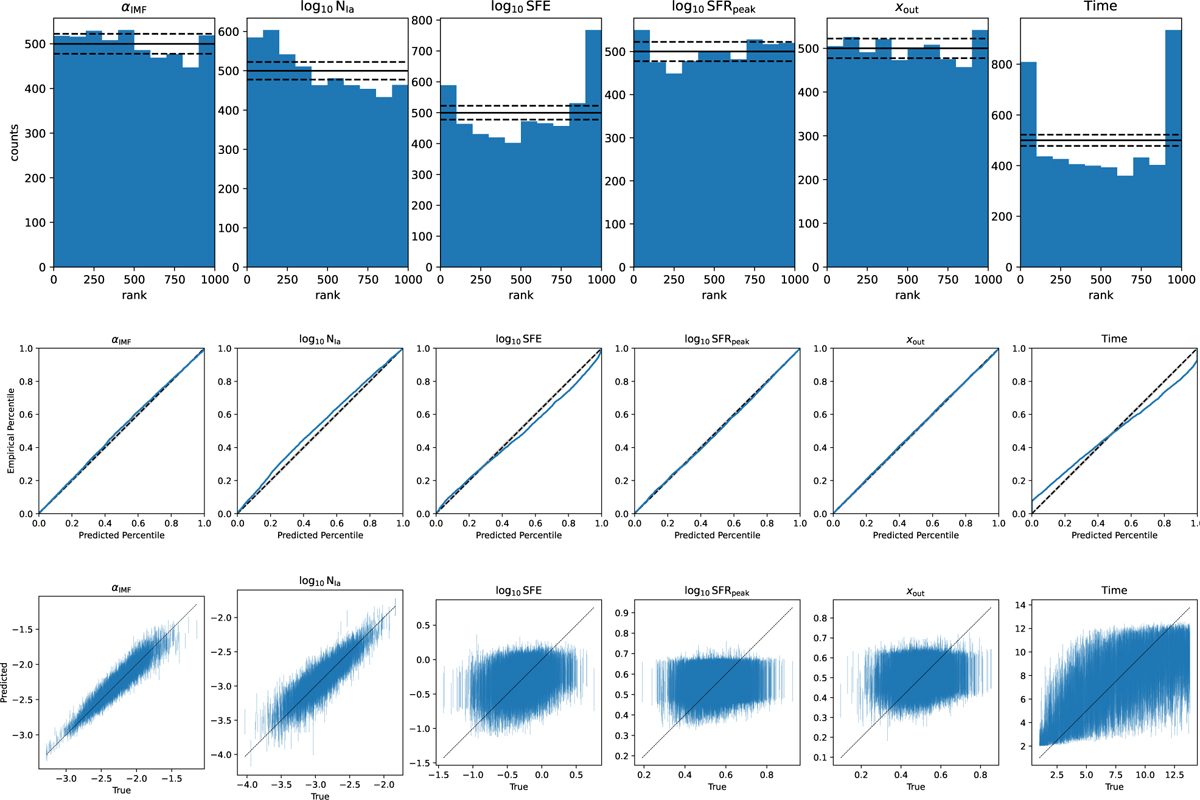
Posterior calibration diagnostics showing from top to bottom the SBC ranks, the TARP plots and the true vs. predicted parameter plots for each of the six parameters. Top: SBC ranks of ground truth parameters under the inferred posterior samples for each of the six parameters (red bars). The grey area shows the 99% confidence interval of a uniform distribution given the number of samples provided. Middle: TARP plot showing the expected coverage probability vs. the credibility level α for each of the six individual parameters in our inference. The dashed black 1:1-line shows an ideal calibrated posterior and the blue solid line shows the TARP value for our NPE. Bottom: True vs. predicted parameter plots showing the average of the posterior samples and as error bar the standard deviation of the samples vs their ground truth parameter.
Current usage metrics show cumulative count of Article Views (full-text article views including HTML views, PDF and ePub downloads, according to the available data) and Abstracts Views on Vision4Press platform.
Data correspond to usage on the plateform after 2015. The current usage metrics is available 48-96 hours after online publication and is updated daily on week days.
Initial download of the metrics may take a while.