Fig. 1.

Download original image
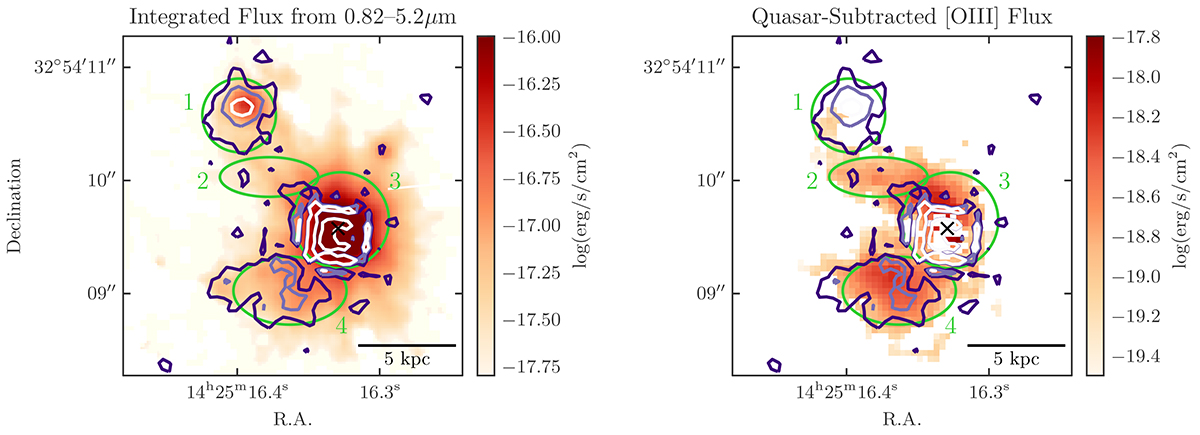
Flux from the background-subtracted data cube integrated across 0.82–5.2 μm (left) and the [O III] λ 5007 flux map after quasar subtraction (right). The fluxes in each spaxel are as indicated in the respective colour bars. Purple to white contours show the quasar-subtracted HST/WFC3 F125W surface brightness (Marshall et al. 2020, who found very similar F160W morphology). Dark purple, light purple, and white correspond to 24.75, 24.00, and 23.25 mag arcsec−1, respectively. Four regions are marked by green elliptical apertures: region 1 is the north-eastern companion galaxy, region 2 is a bridge of connecting gas, the quasar host-galaxy is region 3, and region 4 is the south-eastern companion galaxy. The maps are aligned along the cardinal directions, with north upwards and east to the left.
Current usage metrics show cumulative count of Article Views (full-text article views including HTML views, PDF and ePub downloads, according to the available data) and Abstracts Views on Vision4Press platform.
Data correspond to usage on the plateform after 2015. The current usage metrics is available 48-96 hours after online publication and is updated daily on week days.
Initial download of the metrics may take a while.


