Fig. A.1.
Download original image
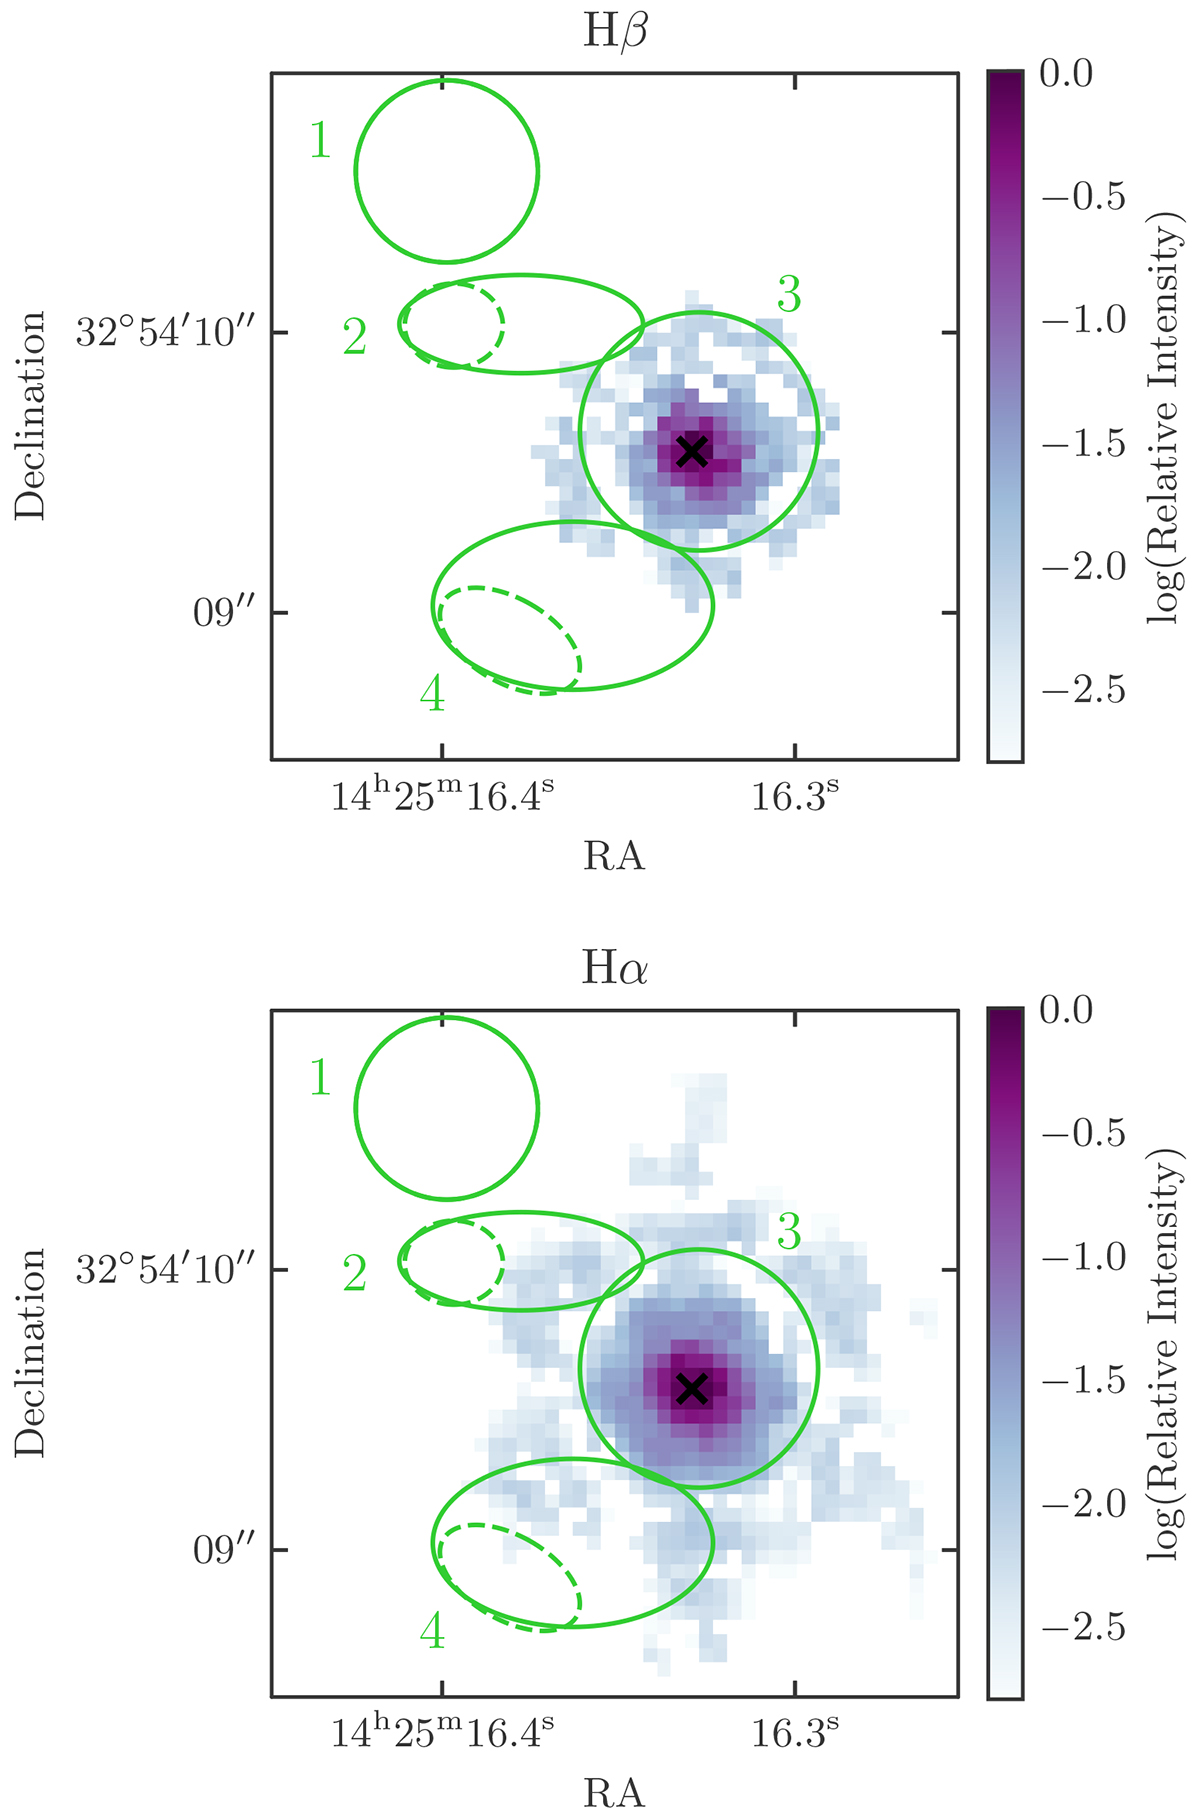
NIRSpec IFU instrumental PSF at 3.35 μm as measured from the broad Hβ line (top), and at 4.52 μm as measured from the broad Hα line (bottom) of NDWFS J1425+3254. The coloured solid ellipses mark the emission line regions as in Figure 1 to assist in visualising the PSF scale. As regions 2 and 4 overlap the quasar PSF, we define two alternate apertures, regions 2* and 4*, within the original apertures but avoiding the region with quasar flux, shown as dashed ellipses. This allows us to extract and model the continuum emission from these regions (Sections 2.3.5 and 4.3) without quasar contamination.
Current usage metrics show cumulative count of Article Views (full-text article views including HTML views, PDF and ePub downloads, according to the available data) and Abstracts Views on Vision4Press platform.
Data correspond to usage on the plateform after 2015. The current usage metrics is available 48-96 hours after online publication and is updated daily on week days.
Initial download of the metrics may take a while.