Fig. B.1.
Download original image
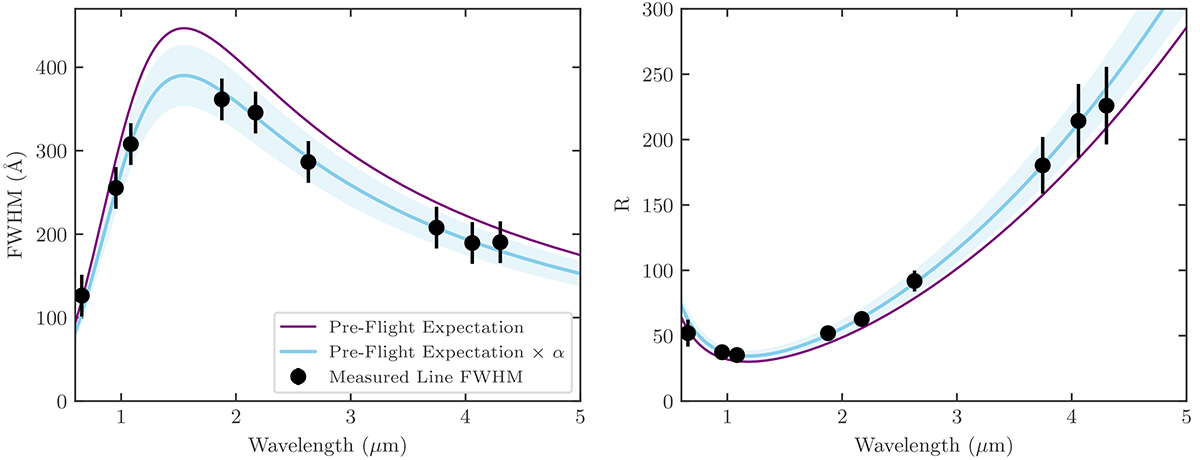
NIRSpec IFU prism instrumental FWHM (left) as a function of wavelength. The purple curve shows the pre-flight estimates. The black points are measurements of emission lines from the planetary nebula SMP LMC 58, which have negligible intrinsic line width. The blue curve is the optimal scaling of the pre-flight expectation to match the observed measurements of the planetary nebula, with the shaded region showing the ±1σ uncertainty. The right panel shows the corresponding spectral resolving power R = λ/FWHM.
Current usage metrics show cumulative count of Article Views (full-text article views including HTML views, PDF and ePub downloads, according to the available data) and Abstracts Views on Vision4Press platform.
Data correspond to usage on the plateform after 2015. The current usage metrics is available 48-96 hours after online publication and is updated daily on week days.
Initial download of the metrics may take a while.