Fig. 2.
Download original image
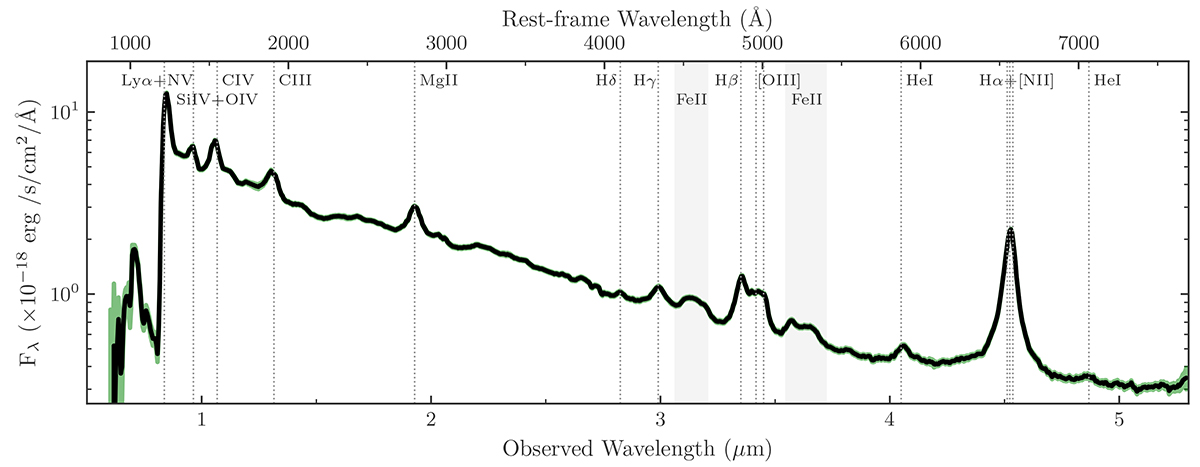
Integrated quasar spectrum (black curve) showing the full wavelength range covered by the NIRSpec prism. The spectrum is measured within an aperture of radius 0![]() 35 centred on the quasar emission peak and has an aperture correction of 1.119× applied. The green region shows the ±5σ uncertainty level of the spectrum, showing that S/N ≫ 5 for λ > 0.65 μm. Key quasar and galaxy emission lines are marked with dotted vertical lines and regions of strong Fe II emission, where the numerous transitions form a pseudo-continuum, are shaded.
35 centred on the quasar emission peak and has an aperture correction of 1.119× applied. The green region shows the ±5σ uncertainty level of the spectrum, showing that S/N ≫ 5 for λ > 0.65 μm. Key quasar and galaxy emission lines are marked with dotted vertical lines and regions of strong Fe II emission, where the numerous transitions form a pseudo-continuum, are shaded.
Current usage metrics show cumulative count of Article Views (full-text article views including HTML views, PDF and ePub downloads, according to the available data) and Abstracts Views on Vision4Press platform.
Data correspond to usage on the plateform after 2015. The current usage metrics is available 48-96 hours after online publication and is updated daily on week days.
Initial download of the metrics may take a while.