Fig. 3.
Download original image
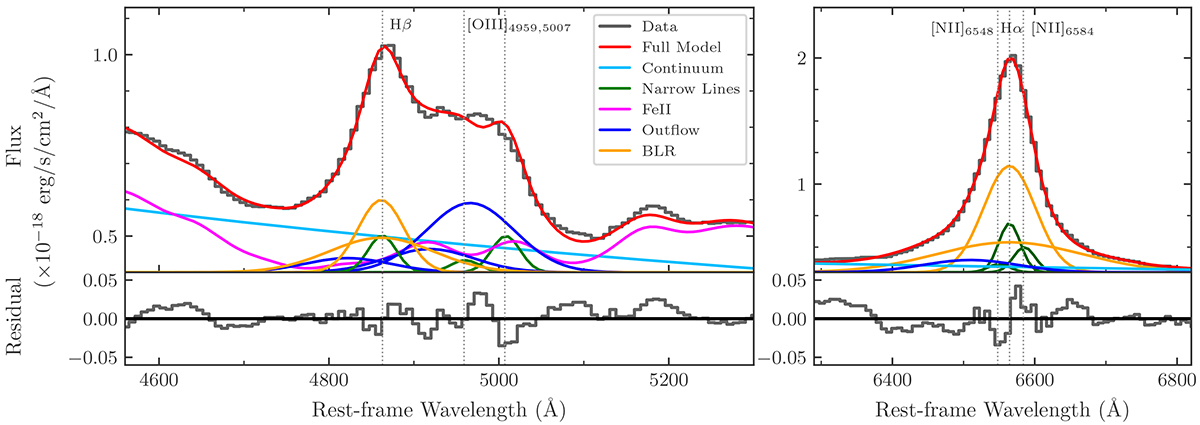
Integrated quasar spectrum in an aperture centred on the peak of the quasar emission: the region around Hβ–[O III] with an aperture radius of 0![]() 25 (left) and the region around Hα–[N II] with an aperture radius of 0
25 (left) and the region around Hα–[N II] with an aperture radius of 0![]() 35 (right). The solid black line in the upper panel shows the observations, and the red line shows the best model fit from QUBESPEC. The individual components of the model fit are also shown as indicated in the legend: the power-law continuum emission, Gaussian narrow and outflow lines, Fe II template (Park et al. 2022), and double-Gaussian BLR model. The emission-line model components are offset by 0.4 × 10⁻¹⁸ erg s−1 cm−2 Å−1 in the left panel and 0.3 × 10⁻¹⁸ erg s−1 cm−2 Å−1 in the right panel to aid in visualisation. The lower panels show the residual between the observed flux and the full model. No aperture correction is applied to this figure, but an aperture correction of 1.119 × for Hα and 1.149 × for Hβ is applied to all calculations from these spectral fits.
35 (right). The solid black line in the upper panel shows the observations, and the red line shows the best model fit from QUBESPEC. The individual components of the model fit are also shown as indicated in the legend: the power-law continuum emission, Gaussian narrow and outflow lines, Fe II template (Park et al. 2022), and double-Gaussian BLR model. The emission-line model components are offset by 0.4 × 10⁻¹⁸ erg s−1 cm−2 Å−1 in the left panel and 0.3 × 10⁻¹⁸ erg s−1 cm−2 Å−1 in the right panel to aid in visualisation. The lower panels show the residual between the observed flux and the full model. No aperture correction is applied to this figure, but an aperture correction of 1.119 × for Hα and 1.149 × for Hβ is applied to all calculations from these spectral fits.
Current usage metrics show cumulative count of Article Views (full-text article views including HTML views, PDF and ePub downloads, according to the available data) and Abstracts Views on Vision4Press platform.
Data correspond to usage on the plateform after 2015. The current usage metrics is available 48-96 hours after online publication and is updated daily on week days.
Initial download of the metrics may take a while.