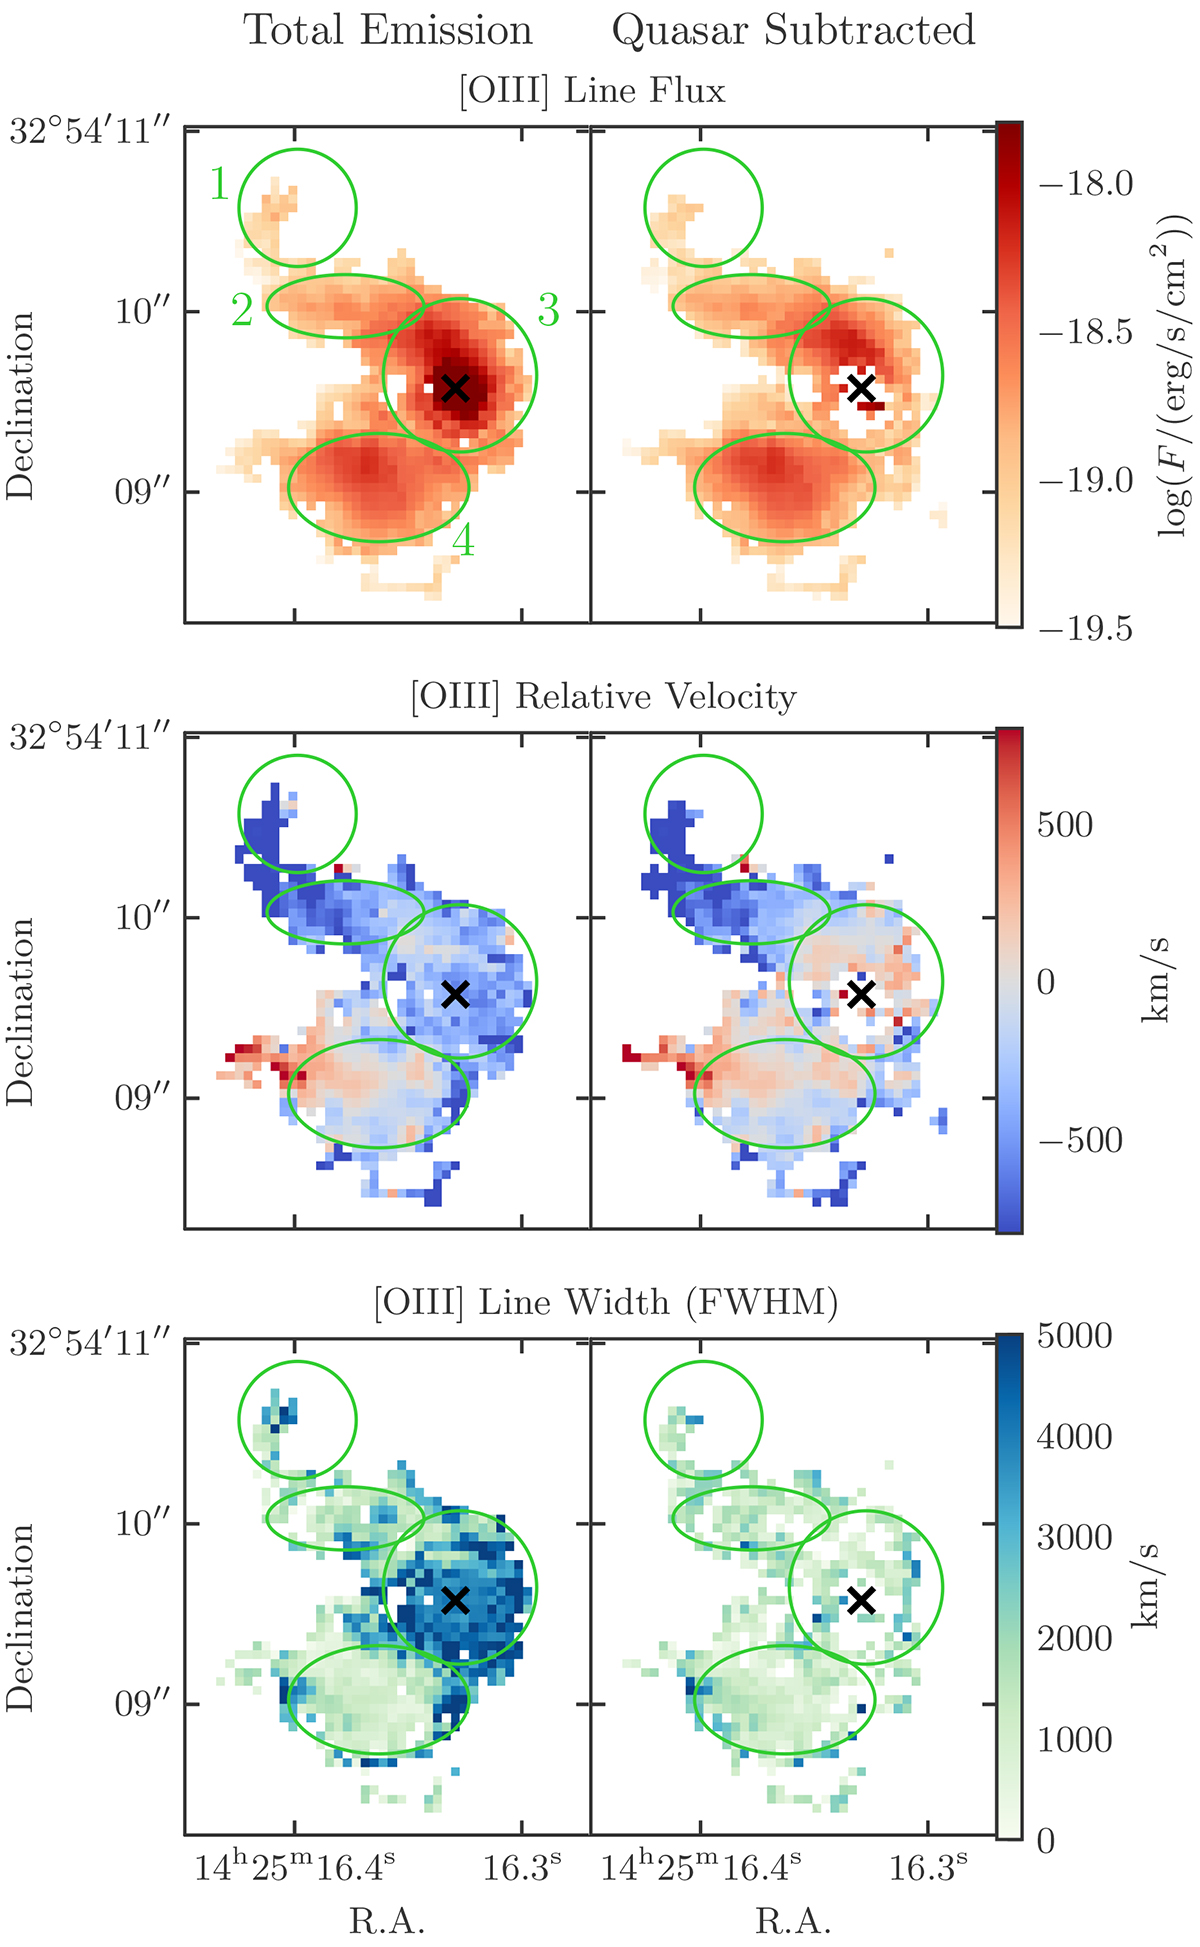
Fig. 5.
Download original image
Maps of the [O III] λ 5007 emission line regions surrounding NDWFS J1425+3254. From top to bottom, the panels show the line flux, velocity, and line width. The left column shows the data cubes containing both the quasar and extended emission, while the right column shows the cubes after the quasar has been subtracted. The location of the quasar is marked as a black cross, and the emission line region apertures from Figure 1 are included for reference. The line velocities and widths are measured from Gaussian fits to the lines in each spaxel; the velocity is measured as the line centre relative to the quasar host redshift of z = 5.901, and the width is the FWHM corrected for the instrumental resolution of 1966 km s−1.
Current usage metrics show cumulative count of Article Views (full-text article views including HTML views, PDF and ePub downloads, according to the available data) and Abstracts Views on Vision4Press platform.
Data correspond to usage on the plateform after 2015. The current usage metrics is available 48-96 hours after online publication and is updated daily on week days.
Initial download of the metrics may take a while.