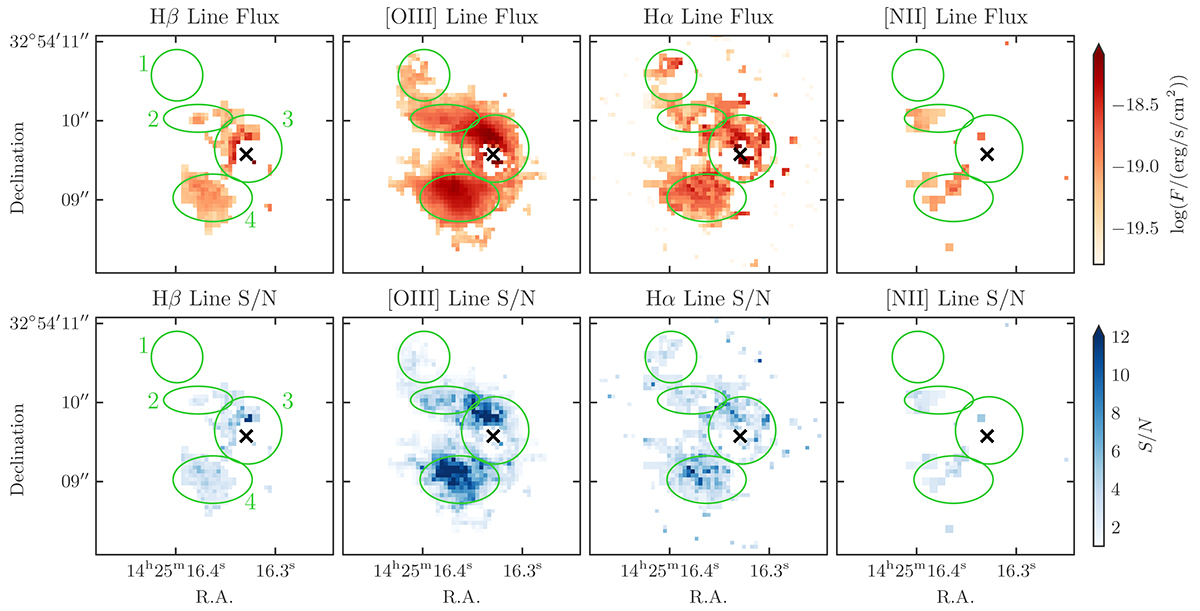
Fig. 6.
Download original image
Maps of the emission-line regions surrounding NDWFS J1425+3254 after the quasar emission has been subtracted. From left to right, the panels show the Hβ, [O III] λ 5007, Hα, and [N II] λ 6584 lines, with the upper panels showing the flux in each spaxel and the lower panels showing their S/N, according to the colour bars at the right of each row. The [O III] λ 5007 and [N II] λ 6584 fluxes are from fits with the doublet flux ratios constrained (Table 3 note). The location of the quasar is marked as a black cross, and the emission-line region apertures from Figure 1 are marked in green.
Current usage metrics show cumulative count of Article Views (full-text article views including HTML views, PDF and ePub downloads, according to the available data) and Abstracts Views on Vision4Press platform.
Data correspond to usage on the plateform after 2015. The current usage metrics is available 48-96 hours after online publication and is updated daily on week days.
Initial download of the metrics may take a while.