Fig. 7.
Download original image
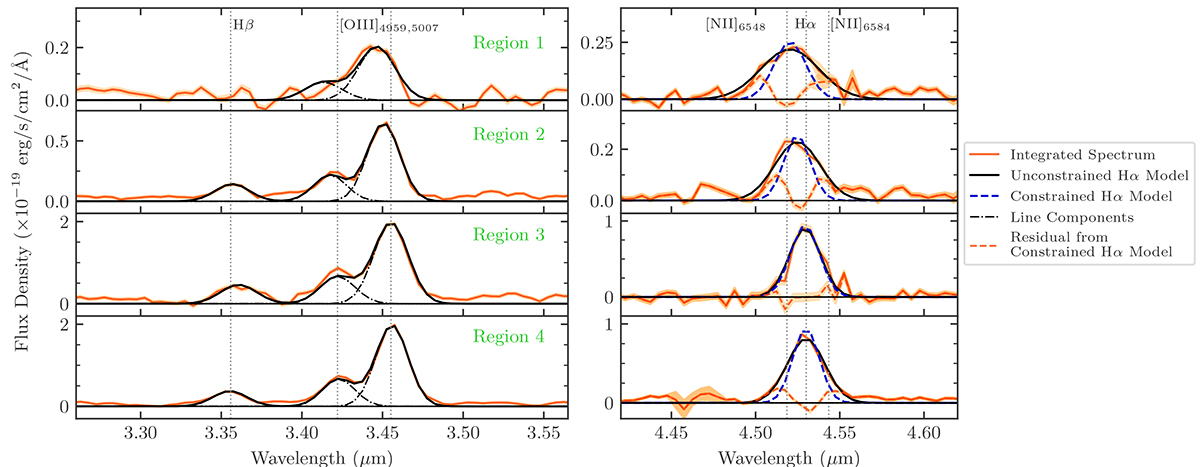
Integrated spectra for the emission-line regions surrounding NDWFS J1425+3254 (orange solid), showing the Hβ–[O III] wavelength range (left panel) and the Hα–[N II] wavelength range (right panel). The blue dashed line shows the best model assuming that the physical line width of Hα is fixed to that of [O III] λ 5007: the ‘constrained Hα model’. The black solid line shows the best model allowing the Hα line width to vary: the ‘unconstrained Hα model.’ The dashed orange line shows the residual around Hα after subtracting the constrained Hα model. The orange shaded region shows the ±1σ uncertainty level of the spectra. The individual Gaussian model components of Hβ and [O III] are shown as dashed lines. The [O III] λ 5007/[O III] λ 4959 ratio is constrained to 2.98. The dotted vertical lines mark the emission line locations at the quasar host redshift, z = 5.901.
Current usage metrics show cumulative count of Article Views (full-text article views including HTML views, PDF and ePub downloads, according to the available data) and Abstracts Views on Vision4Press platform.
Data correspond to usage on the plateform after 2015. The current usage metrics is available 48-96 hours after online publication and is updated daily on week days.
Initial download of the metrics may take a while.