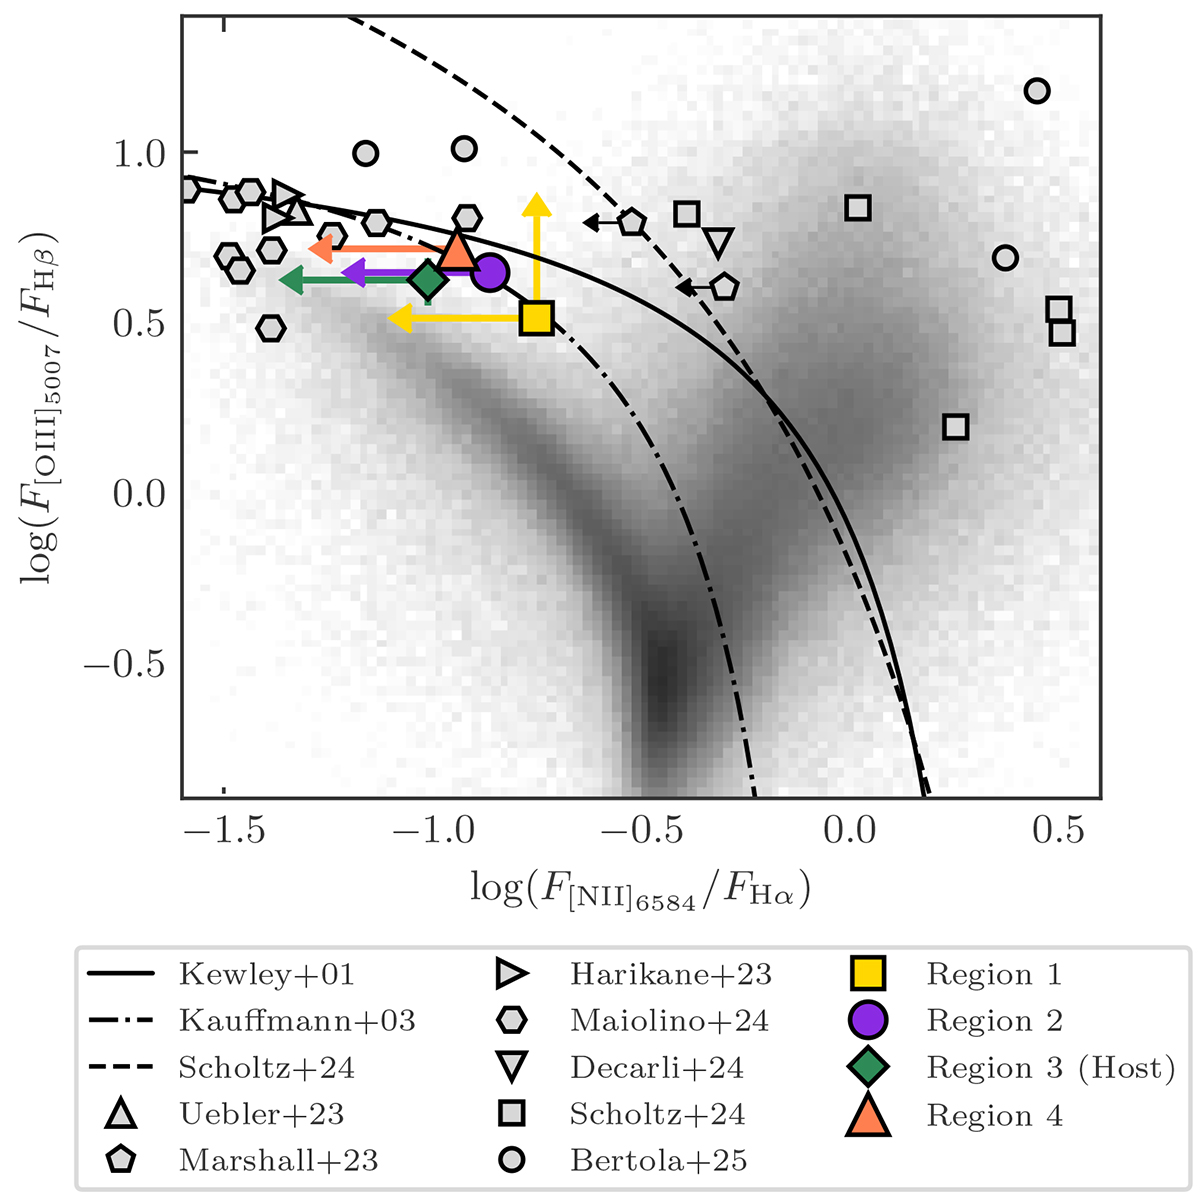
Fig. 8.
Download original image
BPT diagnostic diagram (Baldwin et al. 1981) showing the narrow emission line ratios F[N II]λ6584/FHα and F[O III]λ5007/FHβ for the four regions (coloured data). Our quoted F[N II]/FHα ratios use the [N II] λ 6584 upper limits with FHα, min, giving an upper limit on the ratio. The Kewley et al. (2001), Kauffmann et al. (2003), and Scholtz et al. (2025) demarcation curves distinguish the regions where photoionisation is dominated by galaxies (lower left) and AGNs (upper right), as determined for low-z objects. The underlying grey histogram shows local sources from the SDSS (Abazajian et al. 2009). The grey points show a sample of 3.5 < z < 10 AGN and quasar host galaxies measured with JWST (Übler et al. 2023; Marshall et al. 2023; Harikane et al. 2023; Maiolino et al. 2024; Decarli et al. 2024; Scholtz et al. 2025; Bertola et al. 2025, using the combined narrow and outflow fluxes for sources that were kinematically decoupled into two components to compare to our single-component line fits).
Current usage metrics show cumulative count of Article Views (full-text article views including HTML views, PDF and ePub downloads, according to the available data) and Abstracts Views on Vision4Press platform.
Data correspond to usage on the plateform after 2015. The current usage metrics is available 48-96 hours after online publication and is updated daily on week days.
Initial download of the metrics may take a while.