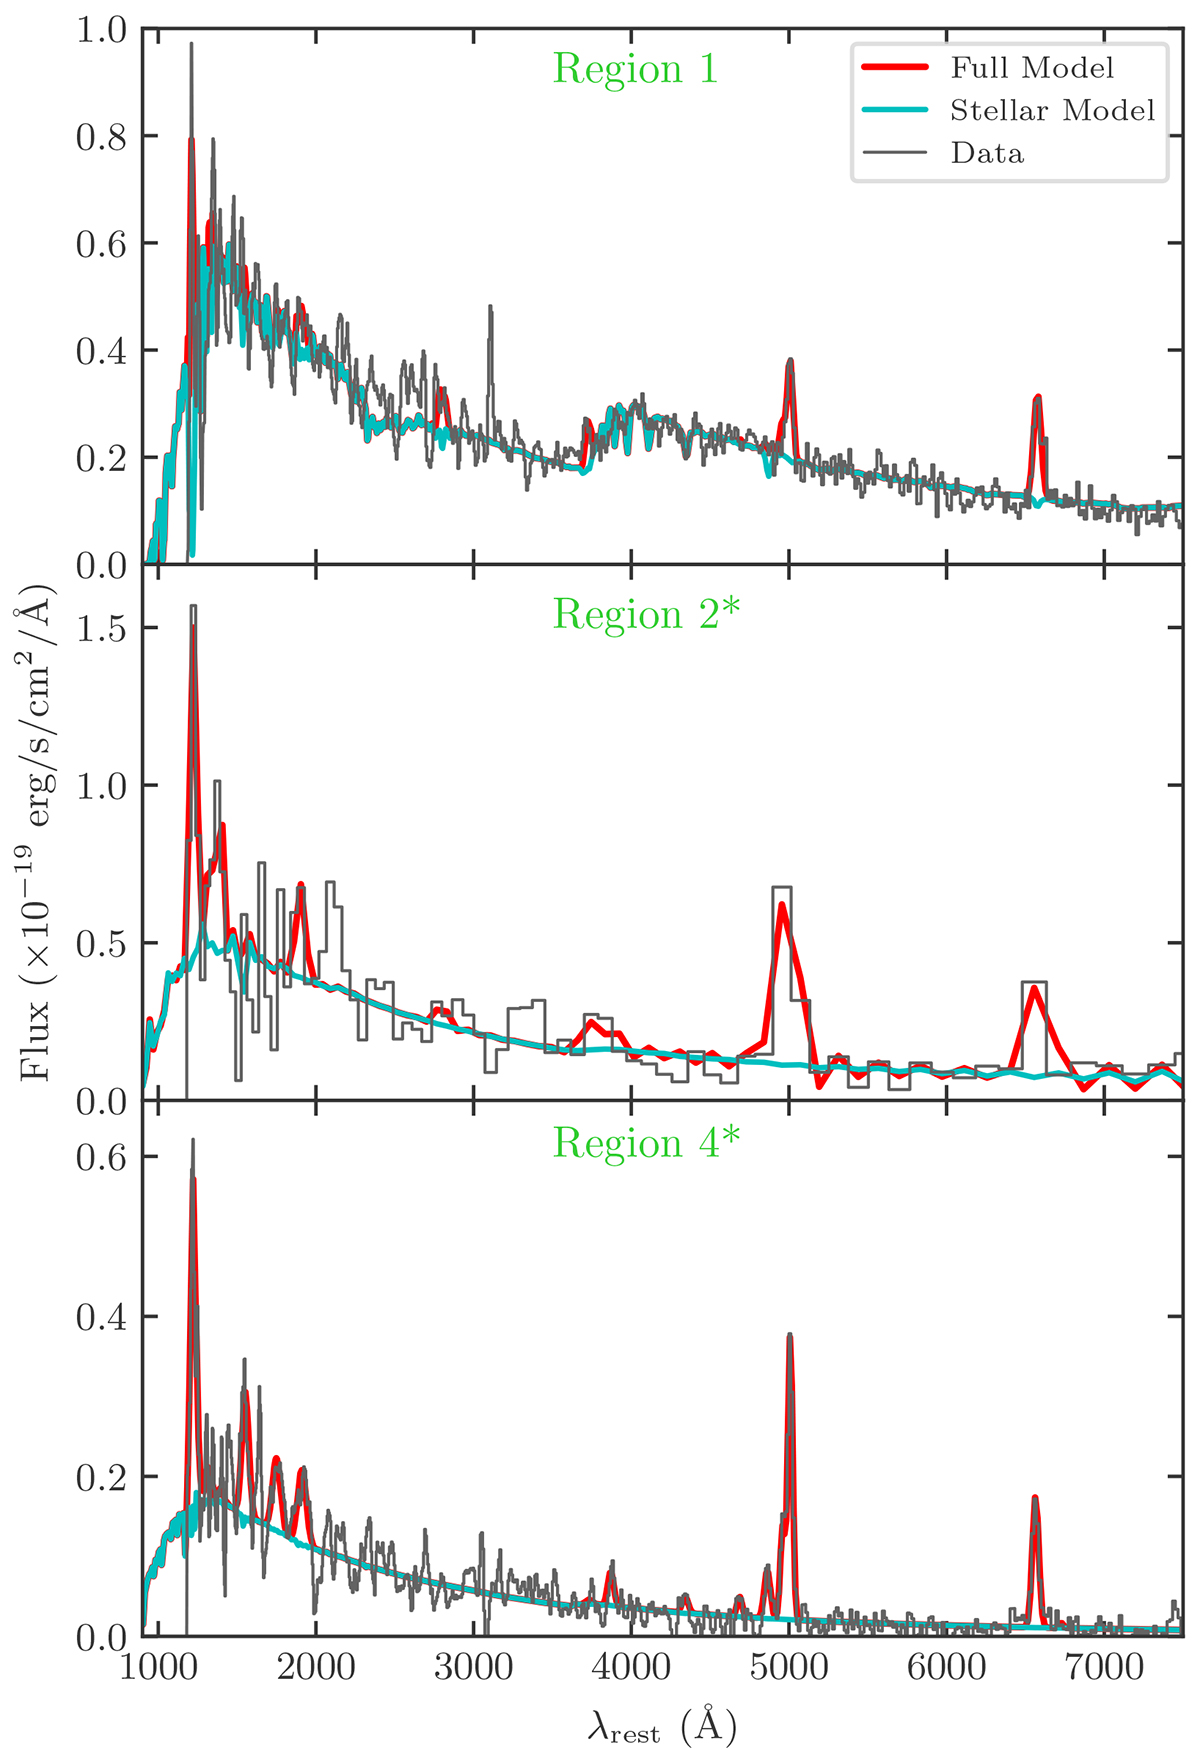
Fig. 9.
Download original image
Spectra for regions 1, 2*, and 4* (black), integrated over the apertures shown in Figure A.1. The red curve shows the full gas and stellar model as fit by PPXF for each region with the stellar component shown in blue. These spectra are taken from the original data cube, which includes the continuum emission and the quasar flux. The apertures for regions 2* and 4* are smaller than regions 2 and 4 to exclude flux from the quasar and thus ensure an accurate measurement of the stellar population. The spectrum for region 2* is rebinned on a 10× coarser wavelength grid to obtain a higher S/N because the continuum has S/N ≲ 5 on the original grid.
Current usage metrics show cumulative count of Article Views (full-text article views including HTML views, PDF and ePub downloads, according to the available data) and Abstracts Views on Vision4Press platform.
Data correspond to usage on the plateform after 2015. The current usage metrics is available 48-96 hours after online publication and is updated daily on week days.
Initial download of the metrics may take a while.