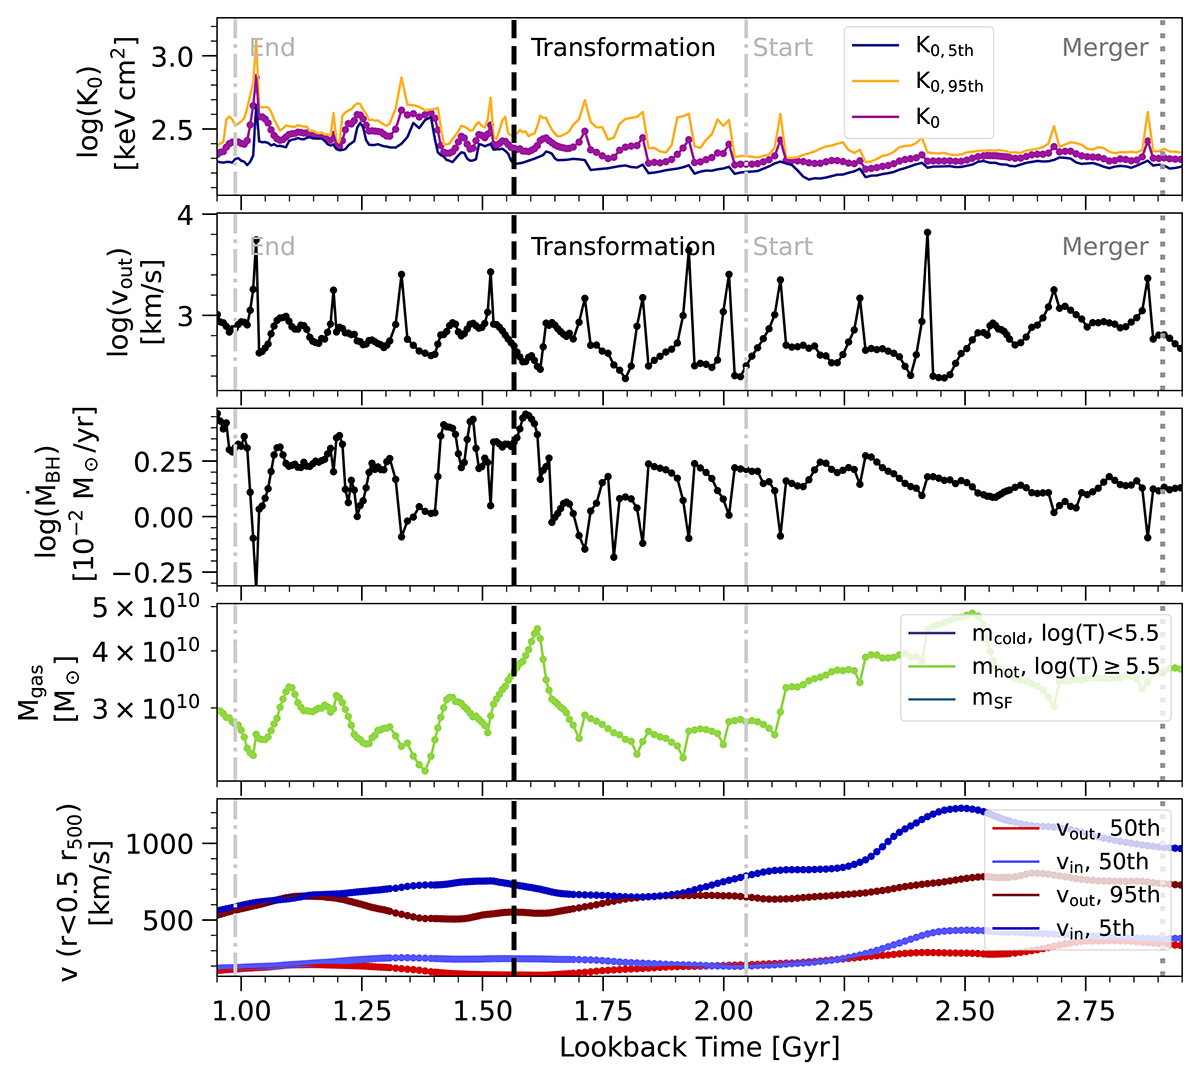
Fig. 14.
Download original image
Evolution of the thermodynamical cluster core properties, as well as AGN feedback activity, as a function of time of an example cluster, the most massive cluster of TNG300 for which we have high temporal cadence output. We show a single halo, followed using the high time-resolution subbox (see text). We focus on a ∼2 Gyr period of time centered on z ≃ 0.1 and the last transformation, and last merger, of this cluster. From top to bottom the panels show: the mean central entropy measured within 10 kpc (purple) and the 5th (blue) and 95th (orange) percentiles; the 95th percentile of the outflow velocity within 10 kpc around the central black hole (black); the instantaneous accretion rate of the central black hole (black); the gas mass within 30 kpc split into hot (T ≥ 105.5 K, green), cold (T < 105.5 K, blue), and star forming phases (teal); the bulk outflow and inflow velocities within 0.5r500c (red and blue, respectively) and the 5th percentile of the inflow velocity (dark blue) and the 95th percentile of the outflow velocity (dark red) also measured within 0.5r500c. The vertical dashed black lines indicate the transformations, the dash-dotted light gray lines indicate the start and end of a transformation, and the dotted dark gray lines show the time of the closest associated merger (all lines are labeled in the first two rows). Repeated AGN feedback episodes are visible as short-timescale peaks in outflow velocity and central entropy that collectively help to transform this cluster into a NCC state.
Current usage metrics show cumulative count of Article Views (full-text article views including HTML views, PDF and ePub downloads, according to the available data) and Abstracts Views on Vision4Press platform.
Data correspond to usage on the plateform after 2015. The current usage metrics is available 48-96 hours after online publication and is updated daily on week days.
Initial download of the metrics may take a while.