Fig. 15.
Download original image
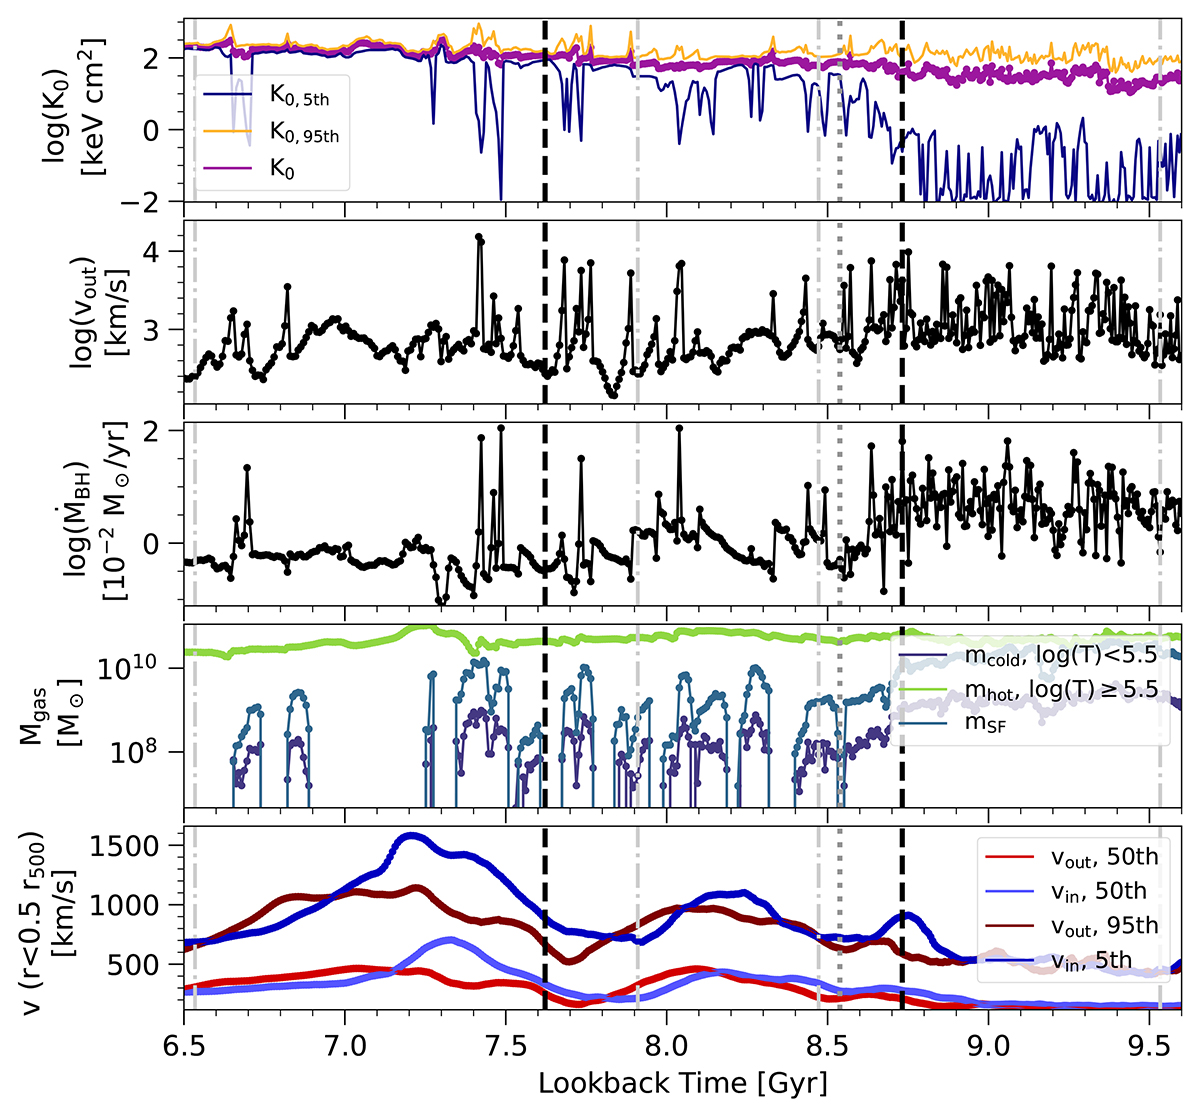
As in Fig. 14, showing the same five quantities and tracking the same cluster from TNG300 through time but here focusing on high redshift, i.e., showing details of the first two transformations to higher core entropy. These occur at z ≃ 1.2 and z ≃ 0.95, and are marked with the vertical dotted black lines. The merger at tlb ≃ 8.5 Gyr causes strong bulk motions in the inner ICM, enhancing the episodic AGN accretion and feedback, which collectively transform and remove cool gas from the cluster core.
Current usage metrics show cumulative count of Article Views (full-text article views including HTML views, PDF and ePub downloads, according to the available data) and Abstracts Views on Vision4Press platform.
Data correspond to usage on the plateform after 2015. The current usage metrics is available 48-96 hours after online publication and is updated daily on week days.
Initial download of the metrics may take a while.