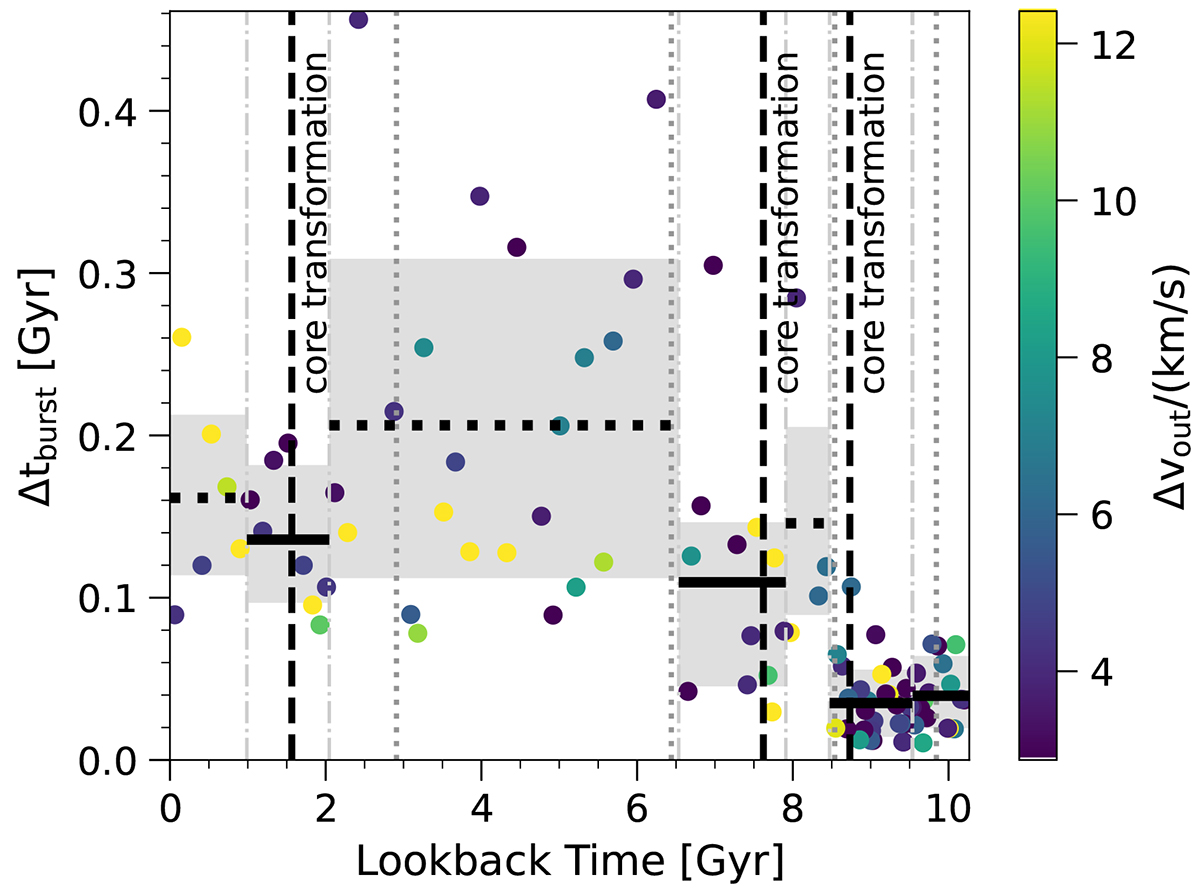
Fig. 16.
Download original image
Time between consecutive SMBH feedback episodes, as a function of time and in relation to periods with and without changes of core entropy, for the most massive cluster of TNG300. These timings are measured from local maxima, i.e., peaks in outflow velocity. Distinct core transformation periods are demarcated with vertical dash-dotted lines, and their times are marked with vertical dashed black lines. Within each core transformation period, the horizontal black lines (gray bands) show the median (one sigma) AGN duty-cycles. Vertical dotted lines indicate mergers (same line styles as Fig. 14). Color encodes relative outflow velocity. We see that this halo experiences phases of higher AGN activity (shorter intervals between consecutive energy injections) during all three core transformations, compared to control periods with no core transformation: in the long lull between the early and late time transformation periods (∼6.5 Gyr to ∼3 Gyr) the AGN of this cluster is least active.
Current usage metrics show cumulative count of Article Views (full-text article views including HTML views, PDF and ePub downloads, according to the available data) and Abstracts Views on Vision4Press platform.
Data correspond to usage on the plateform after 2015. The current usage metrics is available 48-96 hours after online publication and is updated daily on week days.
Initial download of the metrics may take a while.