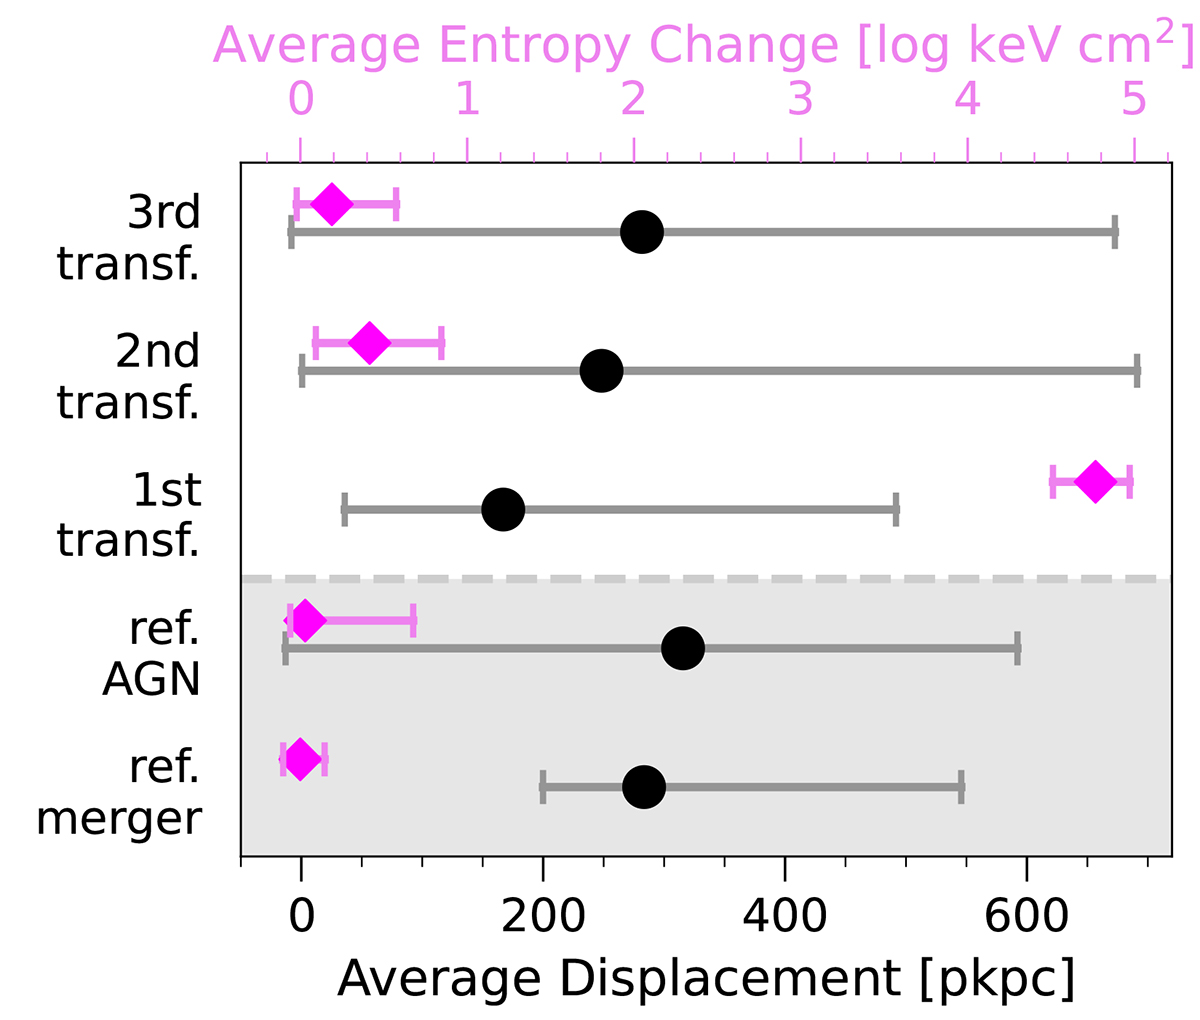
Fig. 18.
Download original image
Heating (i.e., entropy increase) versus displacement of the innermost gas during the core transformations of an example cluster, the most massive of TNG300. We first select the central 1000 gas cells with the lowest entropy. We then measure the difference of the mean halocentric distance (bottom x axis, black markers) and of the mean entropy (top x axis, pink) during specific time periods. The first three rows show the three core transformation episodes of the example cluster of Figs. 14, 15 and 17. The last two rows provide reference values for the same cluster: one for a period of high AGN activity (fourth row) and another for a phase of strong gas displacement due to a merger (fifth row). The error bars indicate first to third quartile ranges of the distributions at the end of each period of time.
Current usage metrics show cumulative count of Article Views (full-text article views including HTML views, PDF and ePub downloads, according to the available data) and Abstracts Views on Vision4Press platform.
Data correspond to usage on the plateform after 2015. The current usage metrics is available 48-96 hours after online publication and is updated daily on week days.
Initial download of the metrics may take a while.