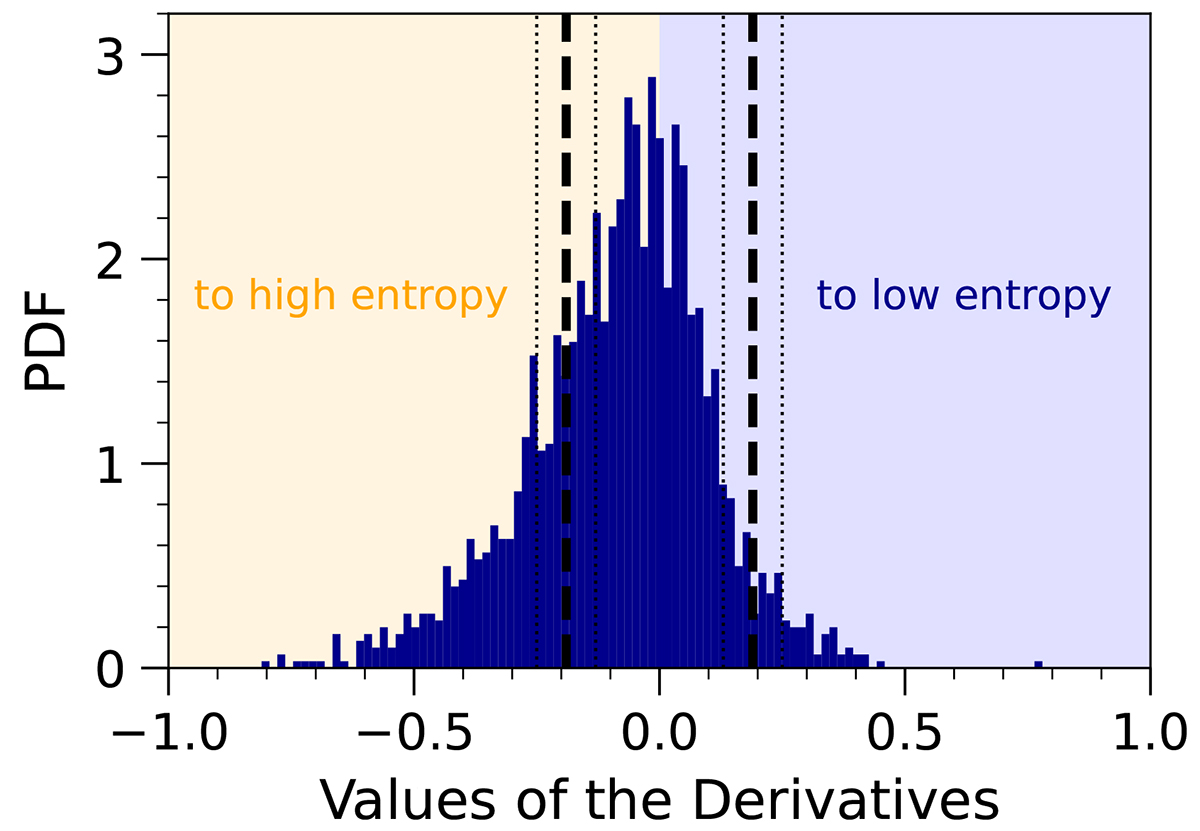
Fig. A.1.
Download original image
Histogram of all local extrema identified in the smoothed derivative of the time evolution of the central entropy for all halos in TNG-Cluster (see Fig. 1 for an exemplary illustration). Negative (positive) derivatives correspond to transformations to higher (lower) core entropy. We find 1874 of such extrema across the whole halo population. The distribution has a mean of -0.08 and a standard deviation of 0.18. For our analysis we considered only significant extrema above a value of 0.19, indicated by the vertical dashed black line. Thus, we selected 478 negative and 97 positive derivatives, i.e., transformations for our analysis. The thinner dotted lines indicate variations in this threshold with values of 0.13 and 0.25.
Current usage metrics show cumulative count of Article Views (full-text article views including HTML views, PDF and ePub downloads, according to the available data) and Abstracts Views on Vision4Press platform.
Data correspond to usage on the plateform after 2015. The current usage metrics is available 48-96 hours after online publication and is updated daily on week days.
Initial download of the metrics may take a while.