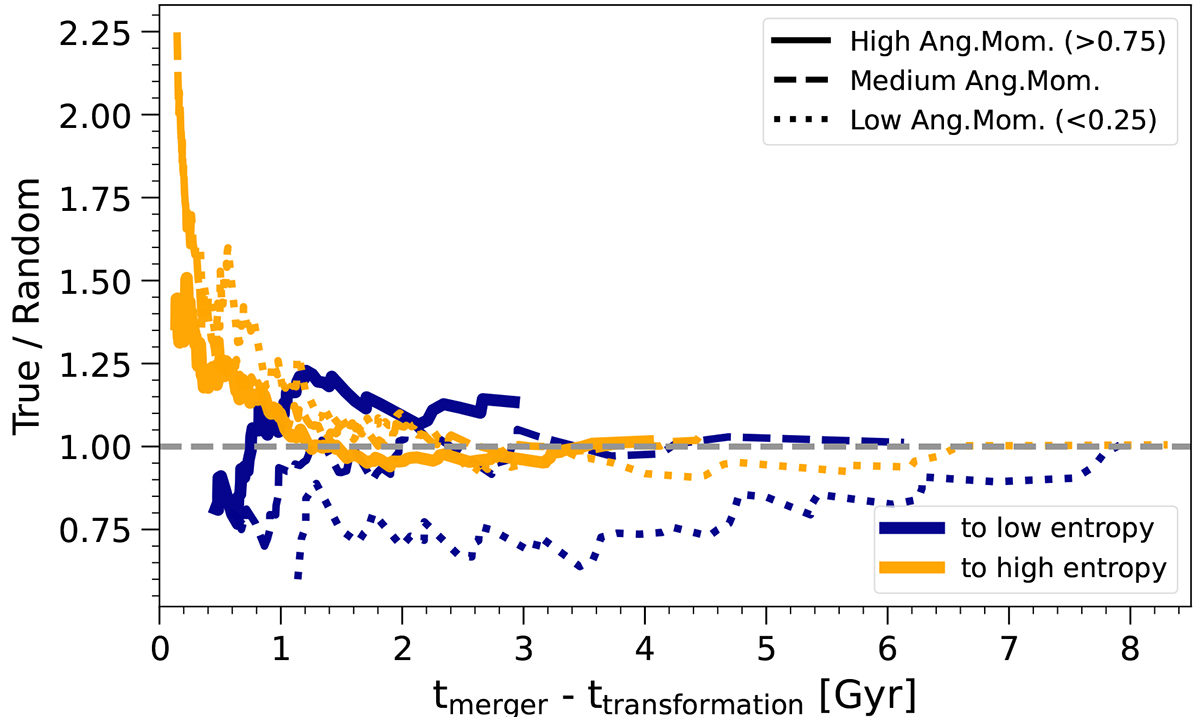
Fig. A.2.
Download original image
As in Fig. 11, considering the cumulative sum of the time difference between each transformation and its closest merger. Here we show the ratio of the true to the random result, where deviation from the unity line indicates that this sub-population has a stronger correlation between mergers and transformations than would be expected from the random shuffled control sample. While the main text studied the dependence of this trend on merger mass ratio, here we consider the dependence on the merger AM.
Current usage metrics show cumulative count of Article Views (full-text article views including HTML views, PDF and ePub downloads, according to the available data) and Abstracts Views on Vision4Press platform.
Data correspond to usage on the plateform after 2015. The current usage metrics is available 48-96 hours after online publication and is updated daily on week days.
Initial download of the metrics may take a while.